
Tổng quan
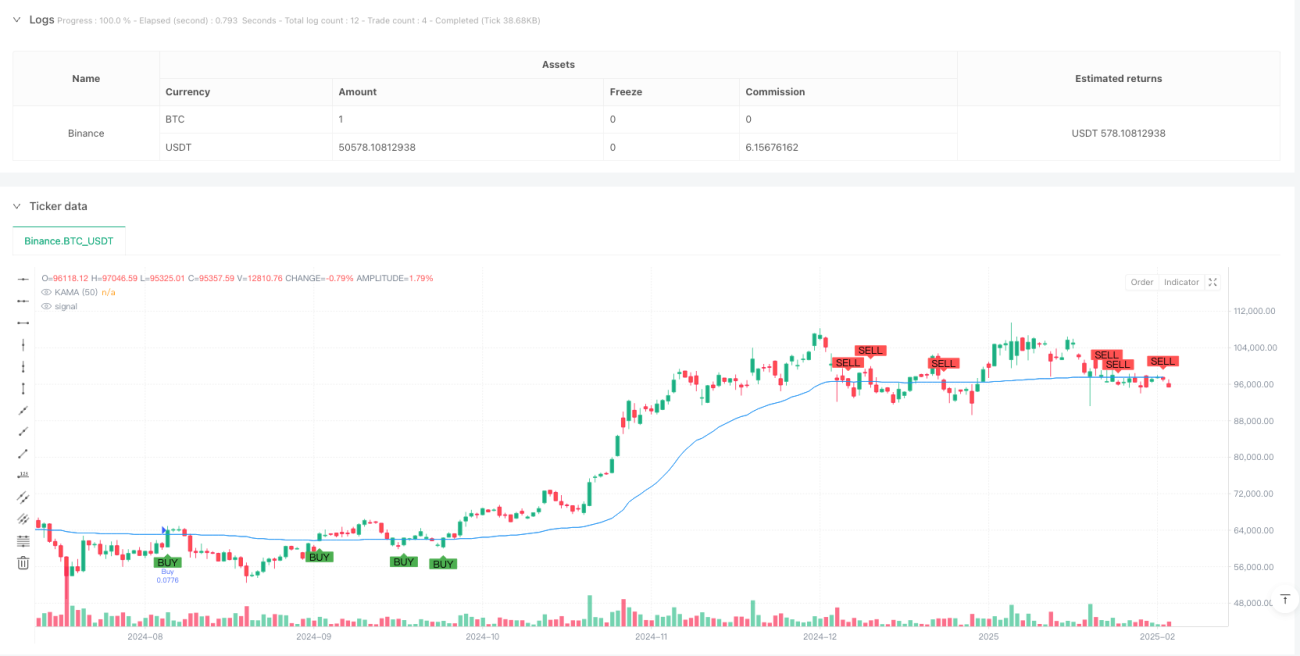
Chiến lược này là một hệ thống theo dõi xu hướng dựa trên đường trung bình di chuyển tự điều chỉnh Kaufman (KAMA) và MACD. Nó thực hiện theo dõi thông minh và nắm bắt chính xác thời gian giao dịch của xu hướng thị trường bằng cách sử dụng KAMA làm chỉ số phán đoán xu hướng chính, kết hợp với MACD làm chỉ số xác nhận động lực. Chiến lược này hoạt động trên khung thời gian 4 giờ, sử dụng các mục tiêu dừng lỗ và lợi nhuận động để quản lý rủi ro.
Nguyên tắc chiến lược
Logic cốt lõi của chiến lược này dựa trên các thành phần chính sau:
- Tính toán KAMA: Sử dụng KAMA 50 chu kỳ làm chỉ số xu hướng chính, điều chỉnh động hệ số mài mòn bằng tỷ lệ hiệu quả, cho phép trung bình di chuyển phù hợp hơn với điều kiện thị trường.
- Xác nhận MACD: sử dụng MACD có thiết lập chậm hơn (<unk> 26, 52, 18) như một công cụ xác nhận xu hướng, đảm bảo hướng giao dịch phù hợp với động lực tổng thể.
- ATR dừng: sử dụng 3 lần ATR 14 chu kỳ làm cơ sở tính toán cho mục tiêu dừng động và lợi nhuận.
- Quy tắc giao dịch:
- Thêm điều kiện: Giá tăng qua KAMA và MACD ở trạng thái giảm giá
- Điều kiện mặc định: Giá vượt qua KAMA và MACD đang giảm giá
- Quản lý rủi ro: Đặt mục tiêu dừng lỗ và lợi nhuận động dựa trên ATR
Lợi thế chiến lược
- Khả năng tự điều chỉnh: KAMA có thể tự động điều chỉnh độ nhạy theo hiệu quả thị trường, duy trì hiệu suất tốt trong các môi trường thị trường khác nhau.
- Tín hiệu đáng tin cậy: kết hợp với xác nhận MACD làm giảm đáng kể nguy cơ đột phá giả.
- Quản lý rủi ro tốt hơn: Sử dụng các mục tiêu dừng lỗ và lợi nhuận động dựa trên tỷ lệ biến động, làm cho quản lý rủi ro có tính thích ứng hơn.
- Không gian tối ưu hóa tham số: Các tham số quan trọng có thể được điều chỉnh theo các đặc điểm thị trường khác nhau.
Rủi ro chiến lược
- Rủi ro đảo ngược xu hướng: Có thể có nhiều tín hiệu sai trong thị trường biến động mạnh.
- Rủi ro bị chậm trễ: KAMA và MACD đều bị chậm trễ, có thể bỏ lỡ thời điểm tốt nhất để nhập học.
- Tính nhạy cảm của tham số: Các tham số có thể cần phải được điều chỉnh để duy trì hiệu quả chiến lược trong các điều kiện thị trường khác nhau.
- Tác động chi phí giao dịch: giao dịch thường xuyên có thể dẫn đến chi phí giao dịch cao hơn.
Hướng tối ưu hóa chiến lược
- Tiếp theo, bạn có thể sử dụng một bộ lọc biến động thị trường để điều chỉnh các tham số chiến lược hoặc tạm dừng giao dịch trong môi trường biến động cao.
- Tăng cường phân tích khối lượng giao dịch, tăng độ chính xác trong việc đánh giá xu hướng.
- Tối ưu hóa cài đặt tham số MACD để phù hợp hơn với khung thời gian 4 giờ.
- Để thực hiện nhân số dừng lỗ thích ứng, điều chỉnh nhân số ATR theo động lực biến động của thị trường.
- Thêm bộ lọc thời gian để tránh giao dịch trong thời gian thị trường có tính thanh khoản thấp.
Tóm tắt
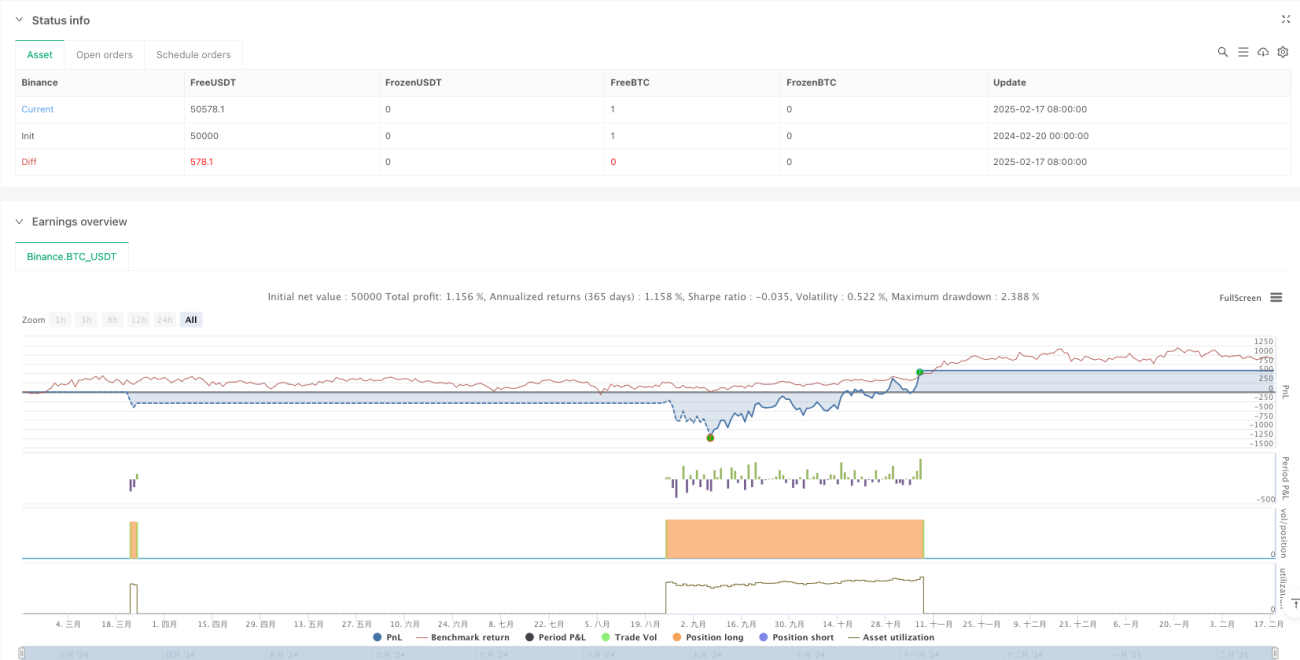
Đây là một chiến lược theo dõi xu hướng kết hợp sự sáng tạo của chỉ số kỹ thuật cổ điển KAMA với MACD. Chiến lược này có khả năng thực tiễn và ổn định mạnh mẽ thông qua sự kết hợp của các moving average và động lượng tự điều chỉnh được xác nhận, cùng với hệ thống quản lý rủi ro hoàn hảo. Mặc dù có một số rủi ro về sự trì trệ và nhạy cảm của tham số, nhưng sự ổn định và lợi nhuận của chiến lược có thể được nâng cao hơn nữa thông qua hướng tối ưu hóa được đề xuất.
- 1