Tổng quan
Chiến lược này là một hệ thống giao dịch tổng hợp dựa trên phân tích kỹ thuật, kết hợp các khu vực hỗ trợ, hình dạng đồ thị và phân tích cấu trúc thị trường. Chiến lược này đưa ra quyết định giao dịch bằng cách xác định mức giá quan trọng, xác nhận tín hiệu đồ thị và đánh giá xu hướng thị trường tổng thể. Hệ thống sử dụng tỷ lệ lợi nhuận rủi ro 1: 3 để quản lý rủi ro thông qua các mục tiêu dừng lỗ và lợi nhuận được đặt trước.
Nguyên tắc chiến lược
Lập luận cốt lõi của chiến lược dựa trên một số thành phần quan trọng sau:
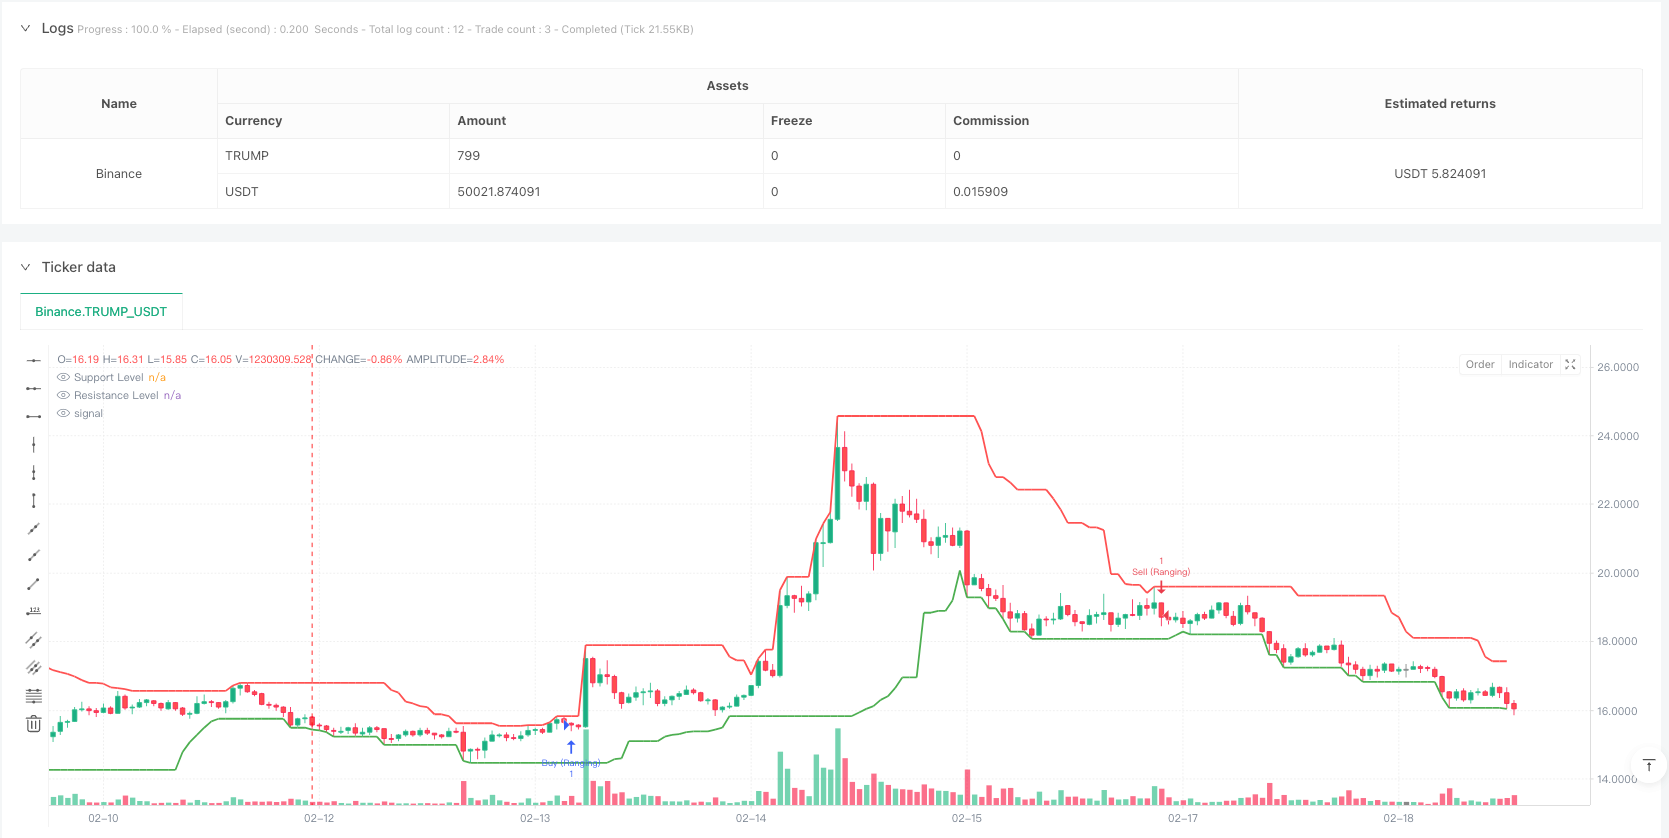
- Xác định vùng kháng cự hỗ trợ - Sử dụng giá cao nhất và giá thấp nhất trong 20 chu kỳ trước để xác định mức giá quan trọng
- Xác nhận hình dạng của biểu đồ - bao gồm các hình dạng điển hình như đợt thâm hụt, thâm hụt, đường nón và đường sao băng
- Phân tích cấu trúc thị trường - Xác định thị trường có xu hướng tăng, xu hướng giảm hoặc dao động theo chuỗi điểm cao và điểm thấp
- Quản lý rủi ro - thiết lập vị trí dừng bằng cách sử dụng số điểm dừng cố định và tỷ lệ lợi nhuận rủi ro 1: 3
Chiến lược có thể hoạt động trong ba môi trường thị trường: thị trường xu hướng, thị trường phân đoạn và thị trường chuyển đổi, nhưng với mỗi môi trường có một tập hợp các quy tắc giao dịch khác nhau.
Lợi thế chiến lược
- Phân tích đa chiều - cung cấp tín hiệu giao dịch đáng tin cậy hơn bằng cách tích hợp mức giá, hình ảnh đồ thị và cấu trúc thị trường
- Khả năng thích ứng - có thể thích ứng với các môi trường thị trường khác nhau, bao gồm xu hướng và khoảng thời gian
- Quản lý rủi ro tốt - Sử dụng tỷ lệ lợi nhuận rủi ro cố định để đảm bảo rằng mỗi giao dịch có kiểm soát rủi ro rõ ràng
- Hỗ trợ hình ảnh - hỗ trợ các vùng kháng cự bằng cách đánh dấu đồ họa, giúp các nhà giao dịch hiểu được tình trạng thị trường
Rủi ro chiến lược
- Rủi ro phá vỡ giả - Giá có thể rút lui nhanh chóng sau khi phá vỡ, tạo ra tín hiệu giả
- Rủi ro trượt - Trong thời gian biến động mạnh, giá giao dịch thực tế có thể sai lệch lớn so với dự kiến
- Nhận thức tham số - lựa chọn các tham số hỗ trợ như chu kỳ kháng cự, chu kỳ cấu trúc thị trường có thể ảnh hưởng đáng kể đến hiệu suất chiến lược
- Tùy thuộc vào môi trường thị trường - có thể không hoạt động tốt trong một thị trường đi một chiều nhanh hoặc biến động mạnh
Hướng tối ưu hóa chiến lược
- Điều chỉnh tham số động - Chu kỳ tính toán của vùng kháng cự hỗ trợ tự động điều chỉnh theo biến động của thị trường
- Tăng cường bộ lọc - thêm các chỉ số như lưu lượng giao thông, tỷ lệ dao động để lọc các tín hiệu đột phá giả
- Tối ưu hóa dừng lỗ - thực hiện thiết lập dừng lỗ động dựa trên ATR để cải thiện khả năng thích ứng với biến động của thị trường
- Xác thực khung giờ - giới thiệu phân tích nhiều khung thời gian để tăng độ tin cậy của tín hiệu
- Tối ưu hóa quản lý vị trí - điều chỉnh kích thước giữ vị trí động dựa trên biến động thị trường và cường độ tín hiệu
Tóm tắt
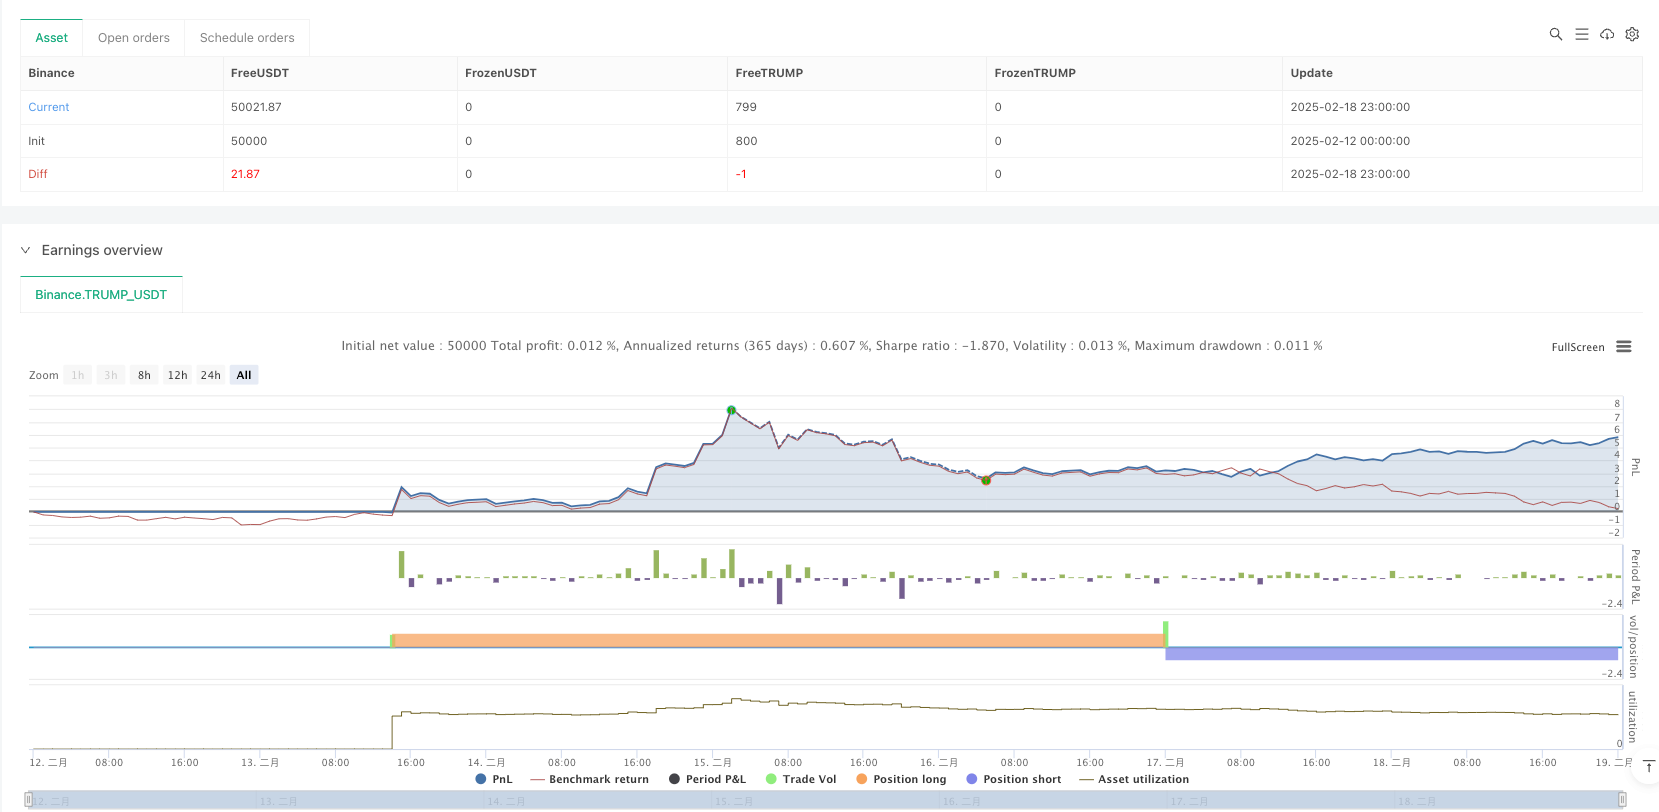
Chiến lược này xây dựng một hệ thống giao dịch hoàn chỉnh bằng cách sử dụng tổng hợp nhiều công cụ phân tích kỹ thuật. Ưu điểm của nó là phân tích đa chiều và quản lý rủi ro tốt, nhưng đồng thời cũng phải đối mặt với những thách thức như đột phá giả và nhạy cảm với các tham số.
/*backtest
start: 2025-02-12 00:00:00
end: 2025-02-19 00:00:00
period: 1h
basePeriod: 1h
exchanges: [{"eid":"Binance","currency":"TRUMP_USDT"}]
*/

//@version=5
strategy("Support/Resistance Strategy with Candlestick Confirmation, Market Structure, and 1:3 R:R", overlay=true)

// Input parameters
supportResistancePeriod = input.int(20, title="Support/Resistance Period", minval=1)
stopLossPips = input.int(50, title="Stop Loss (in pips)", minval=1)
takeProfitRatio = input.float(3.0, title="Risk-to-Reward Ratio", minval=1.0)
structurePeriod = input.int(20, title="Market Structure Period", minval=1)  // Period to determine market structure

// Function to calculate support level (lowest low in the period)
getSupportLevel() =>
    ta.lowest(low, supportResistancePeriod)

// Function to calculate resistance level (highest high in the period)
getResistanceLevel() =>
    ta.highest(high, supportResistancePeriod)

// Get the support and resistance levels
supportLevel = getSupportLevel()
resistanceLevel = getResistanceLevel()

// Function to detect market structure
isBullishTrend() =>
    high[structurePeriod] > high[structurePeriod+1] and low[structurePeriod] > low[structurePeriod+1]

isBearishTrend() =>
    high[structurePeriod] < high[structurePeriod+1] and low[structurePeriod] < low[structurePeriod+1]

isRanging() =>
    not isBullishTrend() and not isBearishTrend()

// Candlestick Pattern Detection Functions
isBullishEngulfing() =>
    close[1] < open[1] and close > open and close > open[1] and open < close[1]

isBearishEngulfing() =>
    close[1] > open[1] and close < open and close < open[1] and open > close[1]

isDoji() =>
    math.abs(close - open) <= (high - low) * 0.1

isHammer() =>
    body = math.abs(close - open)
    upperShadow = high - math.max(close, open)
    lowerShadow = math.min(close, open) - low
    body <= (high - low) * 0.3 and lowerShadow > body * 2 and upperShadow <= body * 0.5

isShootingStar() =>
    body = math.abs(close - open)
    upperShadow = high - math.max(close, open)
    lowerShadow = math.min(close, open) - low
    body <= (high - low) * 0.3 and upperShadow > body * 2 and lowerShadow <= body * 0.5

// Conditions for Buy and Sell based on candle close
buyCondition = (isBullishEngulfing() or isHammer()) and close > supportLevel
sellCondition = (isBearishEngulfing() or isShootingStar()) and close < resistanceLevel

// Define buy/sell conditions based on market structure
bullishMarket = isBullishTrend() and buyCondition
bearishMarket = isBearishTrend() and sellCondition
rangingMarket = isRanging() and (buyCondition or sellCondition)

// Calculate the Stop Loss and Take Profit Levels
longStopLoss = supportLevel - (stopLossPips * syminfo.mintick)
shortStopLoss = resistanceLevel + (stopLossPips * syminfo.mintick)

// Calculate R:R based Take Profit Levels
longTakeProfit = close + (math.abs(close - longStopLoss) * takeProfitRatio)
shortTakeProfit = close - (math.abs(close - shortStopLoss) * takeProfitRatio)

// Plotting Support and Resistance Lines
plot(supportLevel, color=color.green, linewidth=2, title="Support Level", style=plot.style_line)
plot(resistanceLevel, color=color.red, linewidth=2, title="Resistance Level", style=plot.style_line)

// Strategy: Buy on Support, Sell on Resistance with candlestick confirmation and market structure
if (bullishMarket)
    strategy.entry("Buy", strategy.long, stop=longStopLoss, limit=longTakeProfit)

if (bearishMarket)
    strategy.entry("Sell", strategy.short, stop=shortStopLoss, limit=shortTakeProfit)

if (rangingMarket)
    if (buyCondition)
        strategy.entry("Buy (Ranging)", strategy.long, stop=longStopLoss, limit=longTakeProfit)
    if (sellCondition)
        strategy.entry("Sell (Ranging)", strategy.short, stop=shortStopLoss, limit=shortTakeProfit)

// Optional: Highlighting the zones for support and resistance
bgcolor(close > resistanceLevel ? color.new(color.red, 90) : na, title="Resistance Zone")
bgcolor(close < supportLevel ? color.new(color.green, 90) : na, title="Support Zone")