
Tổng quan
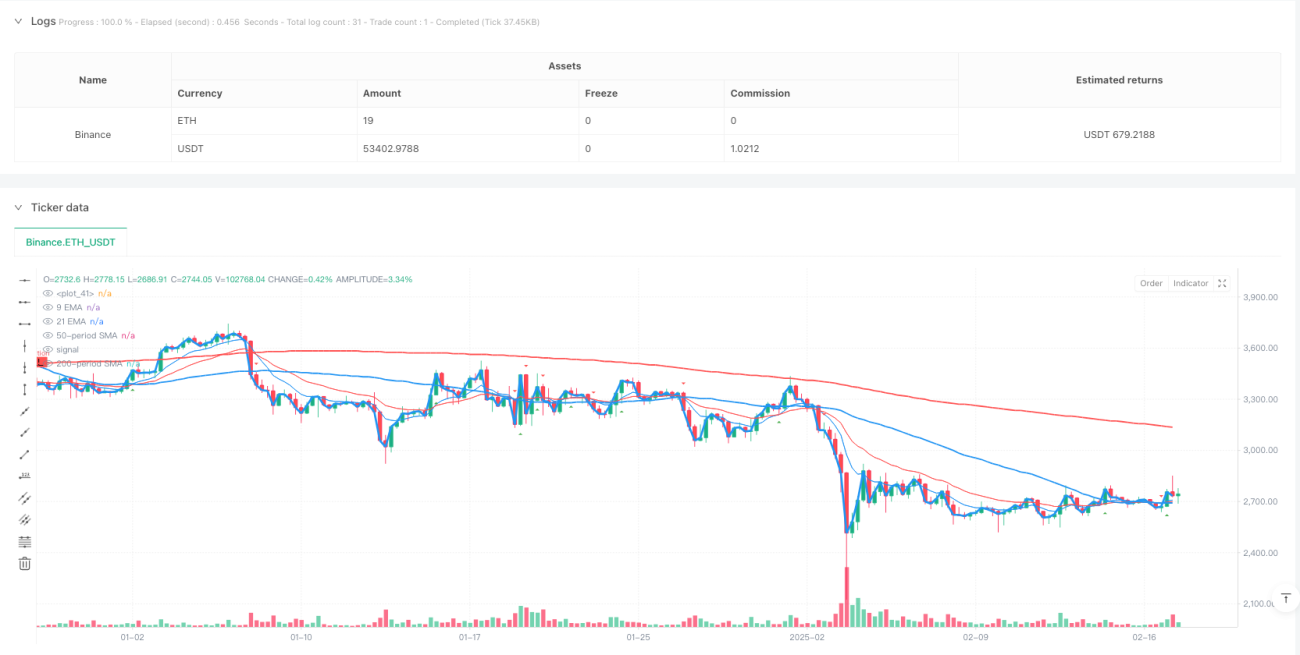
Chiến lược này là một hệ thống giao dịch đảo ngược xu hướng dựa trên kết hợp nhiều đường trung bình, kết hợp các đường trung bình di chuyển 9 chu kỳ, 21 chu kỳ, 50 chu kỳ và 200 chu kỳ để nắm bắt các điểm biến của xu hướng thị trường bằng cách xác định các tín hiệu giao thoa đường trung bình. Chiến lược này tích hợp các lợi thế của đường trung bình ngắn hạn và dài hạn để nắm bắt các thay đổi trong động lực thị trường một cách kịp thời và lọc các tín hiệu giả mạo một cách hiệu quả.
Nguyên tắc chiến lược
Lập luận cốt lõi của chiến lược được xây dựng trên hệ thống chéo đồng tuyến trên nhiều khung thời gian. Cụ thể là:
- Sử dụng trung bình di chuyển đơn giản (SMA) 50 chu kỳ và 200 chu kỳ làm chỉ số định xu hướng chính
- Sử dụng chỉ số di chuyển trung bình 9 chu kỳ và 21 chu kỳ (EMA) để xác nhận tín hiệu ngắn hạn
- Tối ưu hóa chất lượng tín hiệu bằng cách đặt các tham số lookback và threshold
- Xác định các mức giá quan trọng thông qua các thuật toán quan sát dữ liệu kết hợp với các phán đoán về mức giá hỗ trợ và kháng cự quan trọng
Khi đường trung bình ngắn hạn đi lên qua đường trung bình dài hạn, hệ thống phát ra nhiều tín hiệu; ngược lại, phát ra tín hiệu trống.
Lợi thế chiến lược
- Độ tin cậy của hệ thống tín hiệu: giảm đáng kể nguy cơ tín hiệu giả thông qua xác nhận chéo của nhiều đường trung bình
- Tính kịp thời trong việc nắm bắt xu hướng: Việc giới thiệu đường trung bình ngắn hạn cho phép chiến lược phản ứng nhanh chóng với sự thay đổi của thị trường
- Tính toàn diện của kiểm soát rủi ro: nhận diện các vị trí hỗ trợ và kháng cự giúp thiết lập vị trí dừng lỗ hợp lý
- Tính linh hoạt để tối ưu hóa các tham số: Thời gian hồi phục và tham số giảm giá có thể được điều chỉnh theo các điều kiện thị trường khác nhau
- Tính trực quan của hiệu ứng hình ảnh: Hệ thống cung cấp giao diện đồ họa rõ ràng để hỗ trợ quyết định giao dịch
Rủi ro chiến lược
- Rủi ro thị trường chấn động: có thể tạo ra các tín hiệu sai lệch thường xuyên trong giai đoạn sắp xếp ngang
- Rủi ro bị tụt hậu: Đường trung bình di chuyển là một chỉ số bị tụt hậu, có thể bỏ lỡ thời điểm tốt nhất để tham gia
- Độ nhạy của tham số: Các kết hợp tham số khác nhau có thể dẫn đến sự khác biệt lớn về hiệu suất chiến lược
- Tùy thuộc vào môi trường thị trường: Chiến lược hoạt động tốt hơn trong thị trường có xu hướng rõ ràng, và có thể hoạt động kém hơn trong thời gian biến động mạnh
Hướng tối ưu hóa chiến lược
- Nhập số lượng năng lượng: xem xét số lượng giao dịch như một chỉ số phụ trợ cho xác nhận tín hiệu
- Tối ưu hóa lọc tín hiệu: thiết kế cơ chế xác nhận tín hiệu nghiêm ngặt hơn, chẳng hạn như yêu cầu tín hiệu kéo dài một thời gian nhất định
- Điều chỉnh tham số động: Phát triển hệ thống tham số thích ứng, tự động điều chỉnh tham số theo tình trạng thị trường
- Kiểm soát rủi ro tốt hơn: tăng cơ chế dừng lỗ động, bảo vệ lợi nhuận đã có
- Tham gia đánh giá môi trường thị trường: kết hợp với chỉ số biến động, sử dụng các thiết lập tham số khác nhau trong các môi trường thị trường khác nhau
Tóm tắt
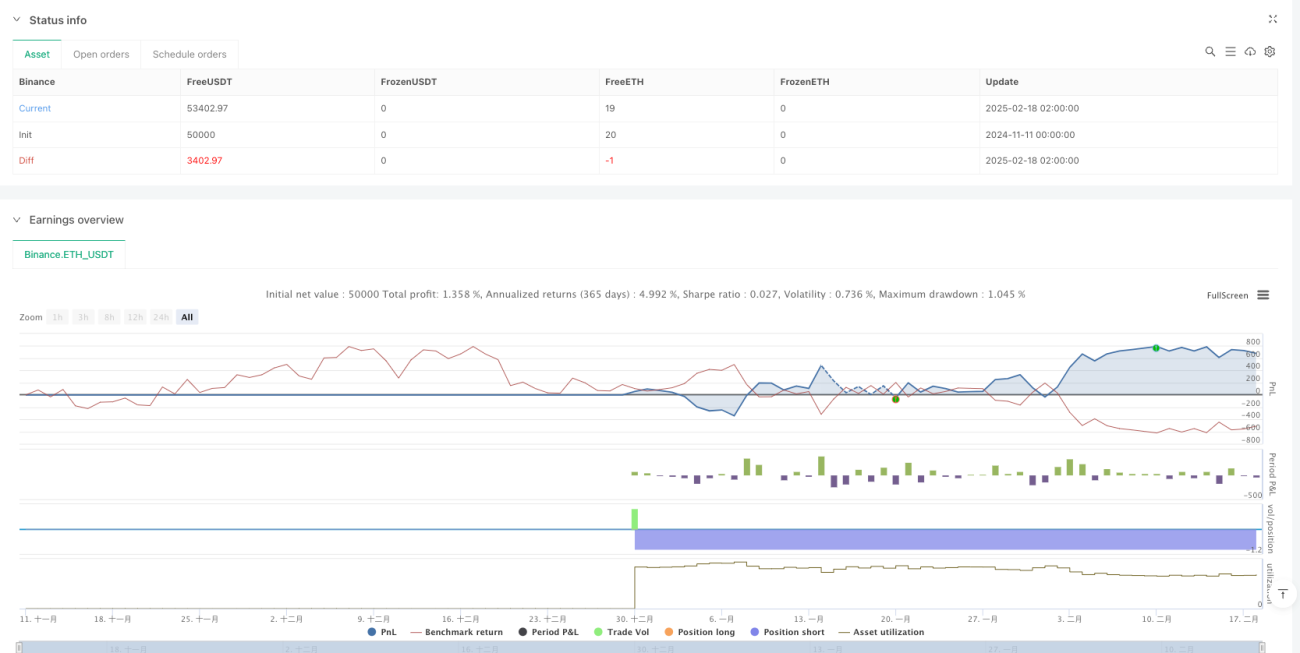
Chiến lược này thông qua sự phối hợp của nhiều hệ thống đường trung bình, có thể xác định hiệu quả các điểm biến đổi xu hướng thị trường. Chiến lược được thiết kế tập trung vào tính thiết thực và khả năng hoạt động, có thể thích ứng với các môi trường thị trường khác nhau thông qua điều chỉnh linh hoạt các tham số. Mặc dù có một số hạn chế, nhưng thông qua việc tối ưu hóa và hoàn thiện liên tục, hiệu suất tổng thể của chiến lược có tiềm năng phát triển tốt hơn.
- 1