Chiến lược theo dõi xu hướng Golden Cross trung bình động hàm mũ nhiều

Tổng quan
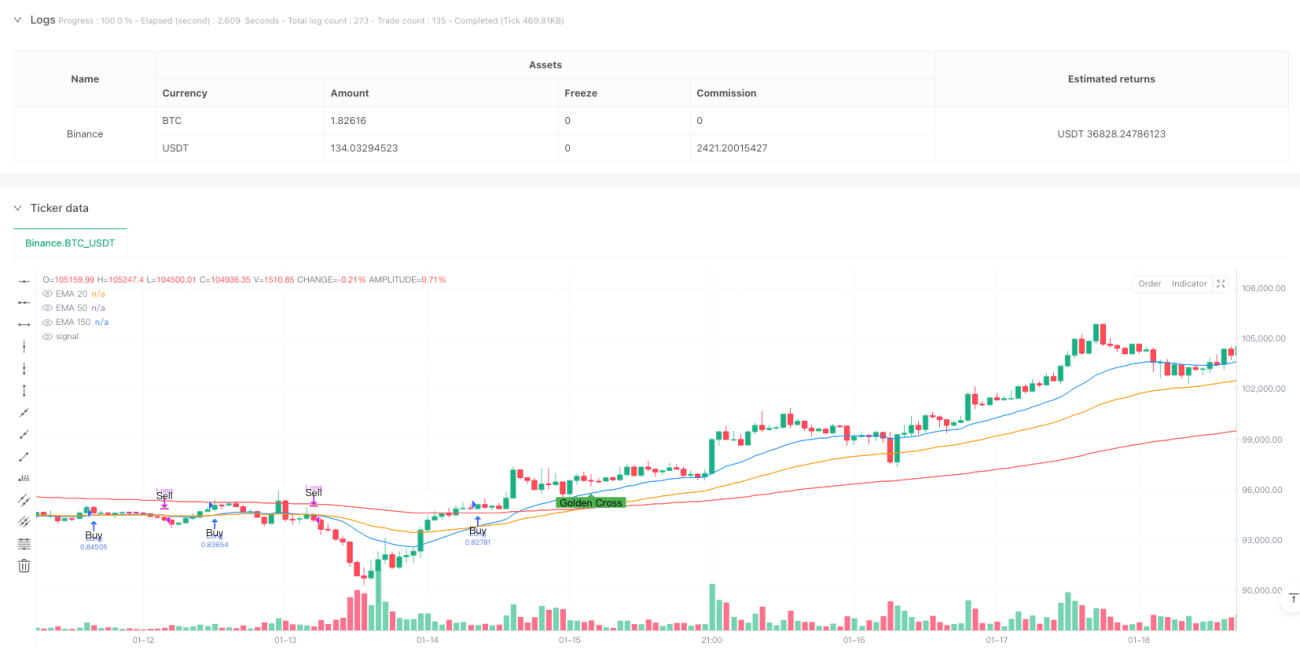
Chiến lược này là một hệ thống theo dõi xu hướng dựa trên các tín hiệu giao thoa đa chỉ số trung bình di chuyển ((EMA)). Bằng cách kết hợp các EMA 20, 50 và 150 chu kỳ, xây dựng một khuôn khổ hoàn chỉnh để nhận biết xu hướng và thực hiện giao dịch. Chiến lược sử dụng mối quan hệ giao thoa giữa các EMA chu kỳ khác nhau để xác định sự thay đổi xu hướng thị trường và thời gian giao dịch cụ thể.
Nguyên tắc chiến lược
Chiến lược này sử dụng các đường trung bình di chuyển chỉ số của ba chu kỳ khác nhau: EMA20 cho xu hướng ngắn hạn, EMA50 cho xu hướng trung hạn, EMA150 cho xu hướng dài hạn. Khi EMA50 vượt qua EMA150 hình thành một đường chéo vàng, cho thấy xu hướng tăng dài hạn được hình thành; khi EMA50 vượt qua EMA150 hình thành một đường chéo chết, cho thấy xu hướng giảm dài hạn được hình thành. Tín hiệu giao dịch cụ thể được tạo ra bởi sự giao nhau của EMA20 và EMA50: Đường chéo EMA50 trên EMA20 tạo ra tín hiệu mua, đường chéo EMA50 dưới EMA20 tạo ra tín hiệu bán.
Lợi thế chiến lược
- Tín hiệu ổn định: Có hiệu quả trong việc giảm tín hiệu giả thông qua việc sử dụng bộ lọc moving average.
- Khả năng nắm bắt xu hướng chính xác: kết hợp với xu hướng ngắn hạn, trung hạn và dài hạn, có thể đánh giá chính xác hơn xu hướng thị trường.
- Kiểm soát rủi ro: Giảm bớt rủi ro khi có xu hướng đảo ngược và tránh rút mạnh
- Các tham số có thể được tối ưu hóa: chu kỳ trung bình di chuyển có thể được điều chỉnh theo các đặc điểm thị trường khác nhau.
- Logic Execution: Các quy tắc giao dịch đơn giản, rõ ràng, dễ hiểu và thực hiện.
Rủi ro chiến lược
- Trở lại xu hướng: Trung bình di chuyển là một chỉ số bị tụt hậu, có thể gây ra một số tổn thất ở điểm chuyển hướng.
- Thị trường chấn động không hoạt động tốt: Trong thị trường chấn động ngang, giao thoa thường xuyên có thể dẫn đến giao dịch quá mức.
- Tính nhạy cảm của tham số: Sự lựa chọn các tham số khác nhau có thể ảnh hưởng đáng kể đến hiệu suất của chiến lược.
- Thị trường thích ứng: Chiến lược hoạt động tốt trong thị trường xu hướng mạnh, nhưng có thể không hiệu quả trong các môi trường thị trường khác.
Hướng tối ưu hóa chiến lược
- Tăng bộ lọc cường độ xu hướng: có thể giới thiệu các chỉ số cường độ xu hướng như ADX, lọc tín hiệu giao dịch trong môi trường xu hướng yếu.
- Tối ưu hóa cơ chế dừng lỗ: Thiết kế các chương trình dừng động, chẳng hạn như dừng tỷ lệ dao động dựa trên ATR.
- Tiến hành điều chỉnh biến động: điều chỉnh các tham số EMA theo biến động của thị trường để tăng khả năng thích ứng của chiến lược.
- Cải thiện quản lý vị thế: Thiết kế hệ thống quản lý vị thế động dựa trên cường độ xu hướng.
- Tăng khả năng đánh giá môi trường thị trường: kết hợp các chỉ số như khối lượng giao dịch, tỷ lệ biến động để đánh giá tình trạng thị trường, chiến lược khởi động chọn lọc.
Tóm tắt
Chiến lược này xây dựng một hệ thống giao dịch theo dõi xu hướng hoàn chỉnh bằng cách sử dụng kết hợp các đường trung bình di chuyển của nhiều chỉ số. Logic của chiến lược rõ ràng, thực hiện đơn giản, có khả năng mở rộng tốt.
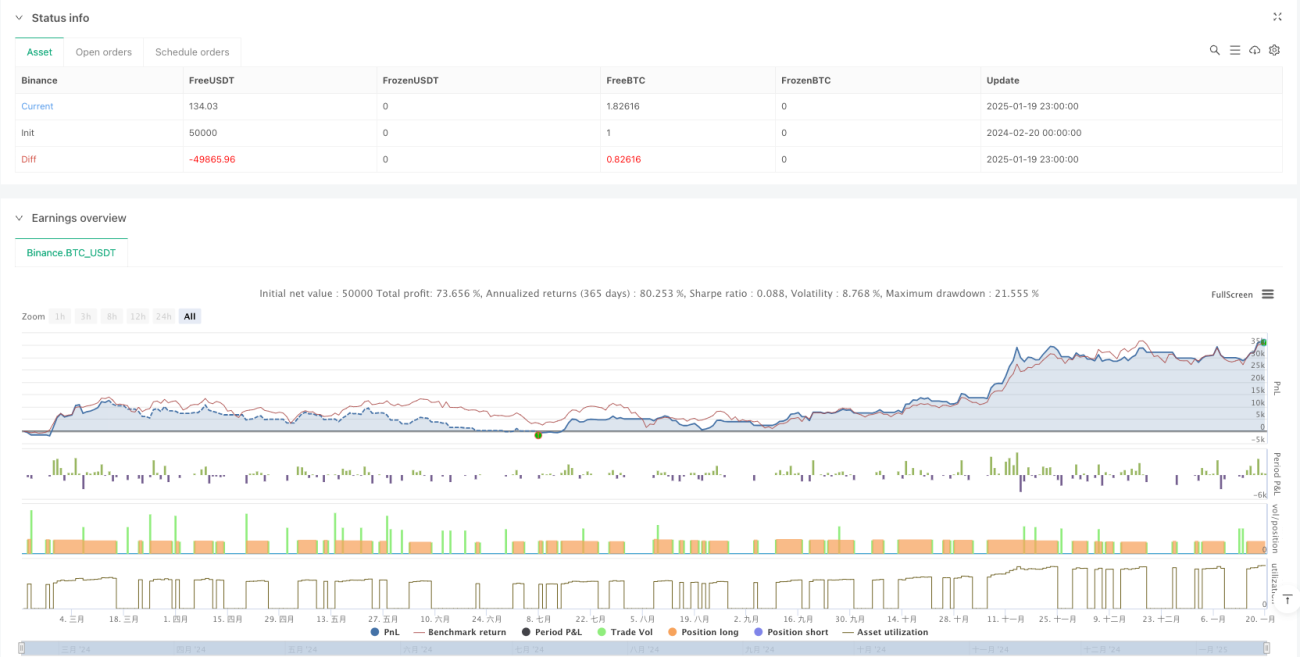
/*backtest
start: 2024-02-20 00:00:00
end: 2025-01-20 00:00:00
period: 1h
basePeriod: 1h
exchanges: [{"eid":"Binance","currency":"BTC_USDT"}]
*/

//@version=6
strategy("EMA2050150 Crossover Strategy#ganges", overlay=true, default_qty_type=strategy.percent_of_equity, default_qty_value=100, commission_value=0.1, slippage=3)
- 1