Chiến lược theo dõi xu hướng đa giai đoạn và xác nhận khối lượng

2
Follow
478
Followers
Tổng quan
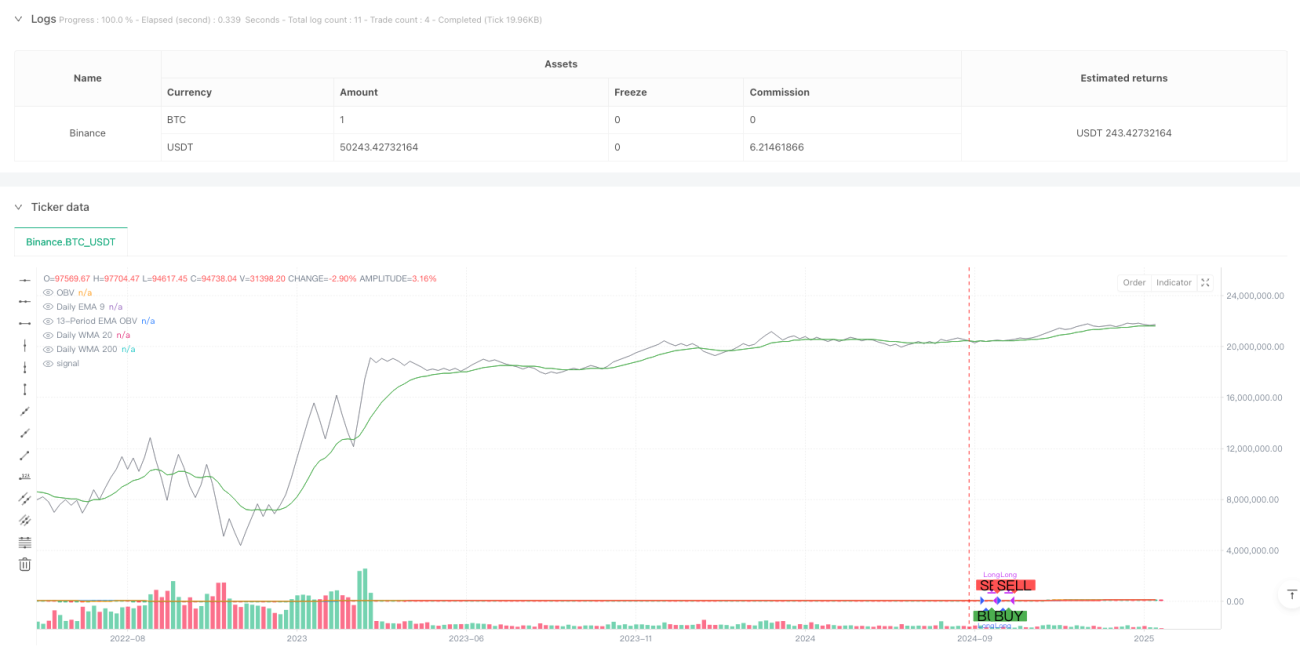
Chiến lược này là một hệ thống theo dõi xu hướng kết hợp trung bình di chuyển nhiều chu kỳ và phân tích khối lượng giao dịch. Chiến lược xác nhận xu hướng tổng thể thông qua ba đường trung bình EMA9, WMA20 và WMA200 của chu kỳ mặt trời, đồng thời giới thiệu chỉ số OBV (On Balance Volume) và EMA để xác nhận khối lượng giao dịch, để thực hiện giao dịch theo dõi xu hướng vững chắc hơn.
Nguyên tắc chiến lược
Chiến lược này hoạt động dựa trên hai điều kiện cốt lõi:
- Xác nhận xu hướng - Xác nhận xu hướng bằng cách đánh giá xem ba đường trung bình ban ngày (EMA9, WMA20, WMA200) có đang tăng không. Khi ba đường trung bình đều nghiêng lên, cho thấy mỗi chu kỳ thời gian có xu hướng đa đầu.
- Xác nhận khối lượng giao dịch - Phân tích khối lượng giao dịch bằng chỉ số OBV và EMA 13 chu kỳ của nó. Khi EMA của OBV nằm trên OBV, cho thấy khối lượng giao dịch hỗ trợ giá tăng, xác nhận tính hiệu quả của xu hướng.
Chỉ khi cả hai điều kiện này được đáp ứng, chiến lược sẽ tạo ra tín hiệu đa. Khi một trong hai điều kiện không được đáp ứng, chiến lược sẽ rút lui.
Lợi thế chiến lược
- Phân tích nhiều khung thời gian - Giảm nguy cơ phá vỡ giả bằng cách xem xét tổng hợp các xu hướng ngắn hạn (EMA9), trung hạn (WMA20) và dài hạn (WMA200).
- Hỗ trợ khối lượng giao dịch - đưa vào phân tích chỉ số OBV để đảm bảo sự hỗ trợ hỗ trợ của khối lượng giao dịch đối với xu hướng giá.
- Kiểm soát rủi ro hoàn hảo - Sử dụng quản lý vị trí phần trăm và tính đến phí xử lý, phù hợp hơn với môi trường giao dịch thực tế.
- Hỗ trợ hình ảnh - Giúp các nhà giao dịch hiểu thời gian nhập và thoát thông qua các biểu tượng đồ họa rõ ràng.
Rủi ro chiến lược
- Trở lại xu hướng chậm trễ - Có thể phản ứng chậm trong giai đoạn đầu của xu hướng thay đổi vì sử dụng xác nhận đường trung bình nhiều lần.
- Không áp dụng cho thị trường rung động - Trong giai đoạn sắp xếp ngang, các đột phá giả thường xuyên có thể dẫn đến quá nhiều giao dịch.
- Chi phí tài chính - phí 0.1% có thể ảnh hưởng đáng kể đến lợi nhuận trong giao dịch tần số cao.
Hướng tối ưu hóa chiến lược
- Tham gia chỉ số biến động - Có thể xem xét thêm các chỉ số biến động như ATR để điều chỉnh vị trí động trong các môi trường thị trường khác nhau.
- Cải thiện cơ chế dừng lỗ - đề xuất thêm chức năng theo dõi dừng lỗ để bảo vệ lợi nhuận tốt hơn.
- Bộ lọc môi trường thị trường - Có thể thêm các chỉ số đánh giá môi trường thị trường, giảm tần suất giao dịch hoặc tạm dừng giao dịch trong thị trường bất ổn.
- Lựa chọn tham số tối ưu hóa - Xem xét tối ưu hóa chu kỳ đường trung bình và tham số OBV cho các thị trường và giống khác nhau.
Tóm tắt
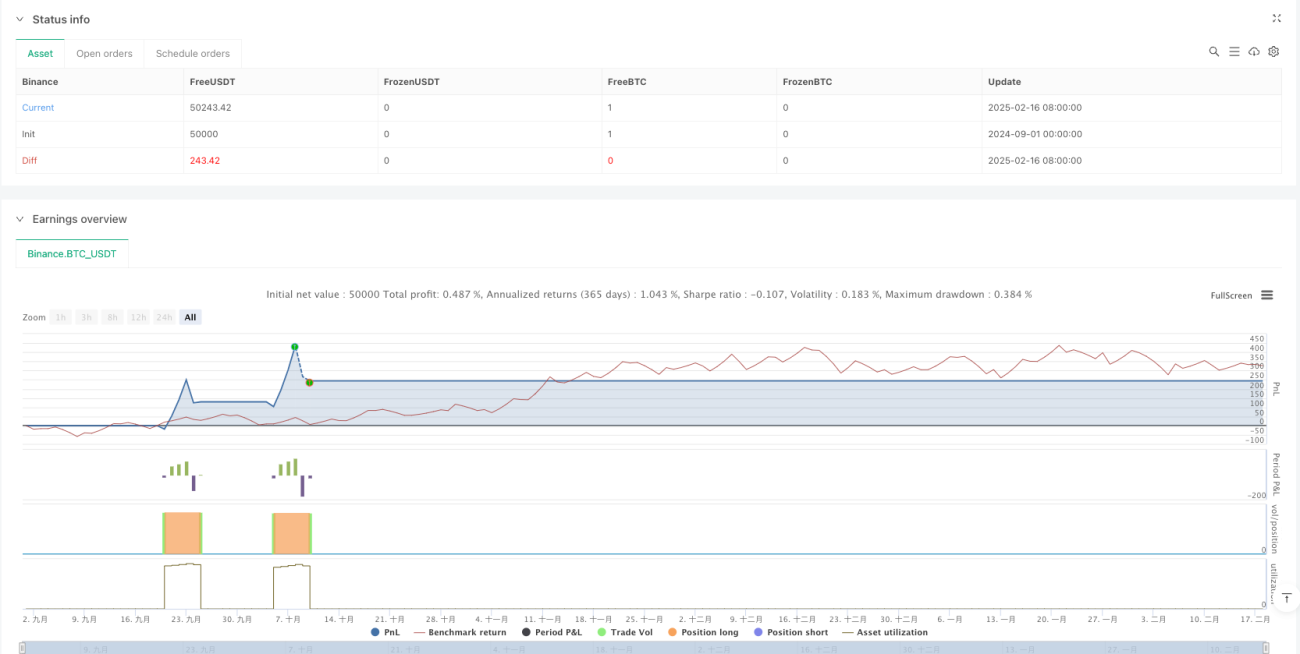
Chiến lược này kết hợp phân tích xu hướng đa chu kỳ và xác nhận khối lượng giao dịch, xây dựng một hệ thống theo dõi xu hướng tương đối hoàn chỉnh. Logic của chiến lược rõ ràng, kiểm soát rủi ro hợp lý, nhưng vẫn có không gian để tối ưu hóa.
Source
Pine
/*backtest
start: 2024-09-01 00:00:00
end: 2025-02-18 08:00:00
period: 5d
basePeriod: 5d
exchanges: [{"eid":"Binance","currency":"BTC_USDT"}]
*/

//@version=6
strategy("Strategy: Daily MAs + OBV", overlay=true, initial_capital=10000, default_qty_type=strategy.percent_of_equity, default_qty_value=10, commission_type=strategy.commission.percent, commission_value=0.1)

//=== Daily Moving Averages Calculation =========================Related strategies
Comment
All comments (0)
No data
- 1