Chiến lược giao cắt ngẫu nhiên và xu hướng động lượng SuperTrend

Tổng quan
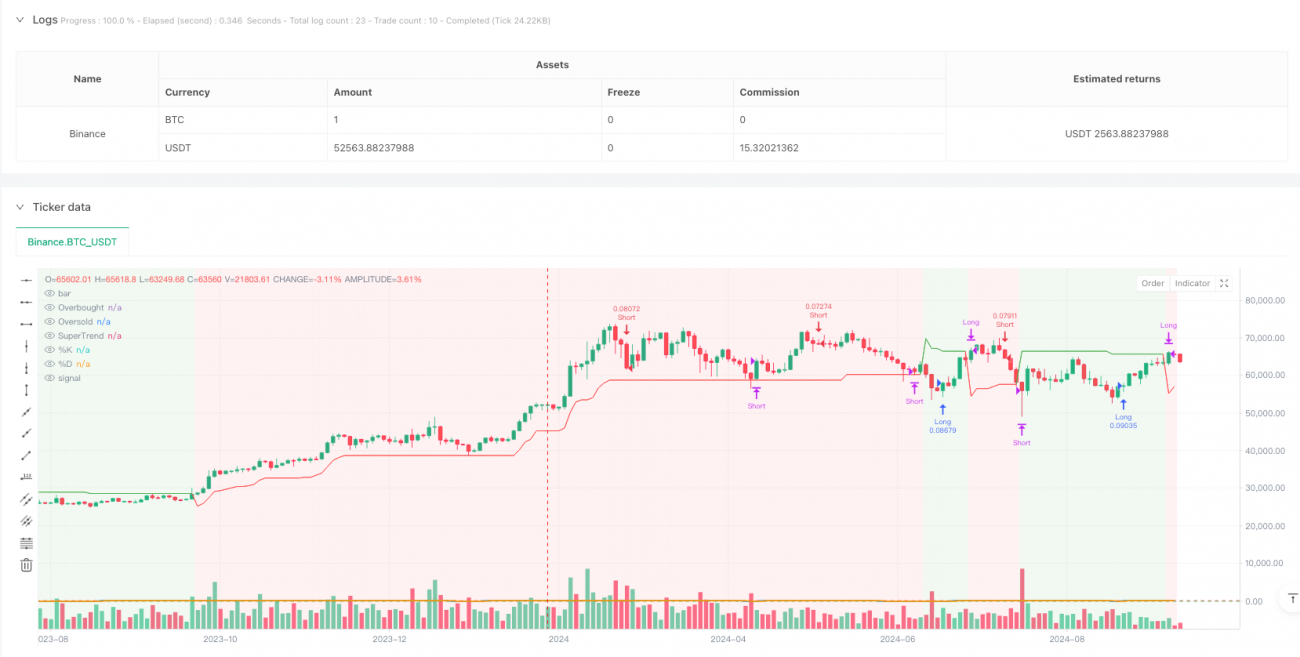
Chiến lược này là một hệ thống giao dịch theo dõi xu hướng kết hợp các chỉ số SuperTrend và chỉ số ngẫu nhiên (Stochastic Oscillator). Chiến lược này xác định hướng xu hướng thị trường thông qua các chỉ số SuperTrend, đồng thời sử dụng tín hiệu mua quá mức của các chỉ số ngẫu nhiên làm tín hiệu xác nhận giao dịch. Chiến lược sử dụng phương pháp chéo động lực để tìm kiếm thời gian vào và ra khỏi tốt nhất theo hướng xu hướng, thực hiện sự kết hợp hoàn hảo của theo dõi xu hướng với phân tích động lực.
Nguyên tắc chiến lược
Lý luận cốt lõi của chiến lược này dựa trên sự kết hợp của hai chỉ số chính:
- Chỉ số SuperTrend: dựa trên ATR ((trung lượng sóng thực trung bình), được tính toán để xác định xu hướng thị trường. Khi đường chỉ số chuyển từ đỏ sang xanh, nó biểu thị xu hướng tăng, và khi chuyển từ xanh sang đỏ, nó biểu thị xu hướng giảm.
- Chỉ số ngẫu nhiên: được sử dụng để xác định tình trạng quá mua quá bán của thị trường. Sử dụng các tham số % K chu kỳ là 14,% D chu kỳ là 3, mức quá mua là 80 và mức quá bán là 20.
Các quy tắc giao dịch là:
- Làm nhiều điều kiện: SuperTrend hiển thị xu hướng tăng ((màu xanh lá cây), và chỉ số ngẫu nhiên % K đường từ dưới lên vượt qua mức bán tháo ((20)
- Điều kiện thả: SuperTrend hiển thị xu hướng giảm (đỏ) và chỉ số ngẫu nhiên % K đường đi từ trên xuống qua mức vượt mức mua (80).
- Điều kiện đồng đa: SuperTrend chuyển sang xu hướng giảm, hoặc chỉ số ngẫu nhiên% K đường đi xuống vượt quá mức mua
- Điều kiện không gian phẳng: SuperTrend chuyển sang xu hướng tăng, hoặc chỉ số ngẫu nhiên % K đường đi lên vượt quá mức bán tháo
Lợi thế chiến lược
- Xác định xu hướng: Xác định hiệu quả xu hướng thị trường chủ đạo thông qua chỉ số SuperTrend, giảm nguy cơ phá vỡ giả
- Xác minh động lực: tín hiệu động lực kết hợp với các chỉ số ngẫu nhiên, tăng độ chính xác và kịp thời của giao dịch
- Kiểm soát rủi ro: Sử dụng mức Overbought và OverSold như một điểm dừng lỗ để cung cấp một khung quản lý rủi ro rõ ràng
- Hiệu ứng trực quan: Chiến lược cung cấp giao diện đồ họa trực quan, bao gồm màu nền xu hướng và thay đổi đường chỉ số, giúp thương nhân hiểu được tình trạng thị trường
- Tính linh hoạt về tham số: Tất cả các tham số quan trọng có thể được điều chỉnh tối ưu hóa theo các đặc điểm thị trường khác nhau
Rủi ro chiến lược
- Rủi ro thị trường chấn động: có thể tạo ra các tín hiệu sai lệch thường xuyên trong giai đoạn sắp xếp ngang, dẫn đến giao dịch quá mức
- Rủi ro bị tụt hậu: cả SuperTrend và chỉ số ngẫu nhiên đều có một số độ trễ, có thể bỏ lỡ thời điểm đầu vào tốt nhất
- Tính nhạy cảm của tham số: các thiết lập tham số khác nhau có thể dẫn đến kết quả giao dịch khác nhau đáng kể, cần được kiểm tra đầy đủ
- Tùy thuộc vào môi trường thị trường: Chiến lược hoạt động tốt trong thị trường có xu hướng mạnh, nhưng có thể hoạt động kém trong thị trường biến động mạnh
- Hình ảnh xung đột: hai chỉ số có thể tạo ra các tín hiệu mâu thuẫn, cần thiết phải thiết lập các quy tắc ưu tiên rõ ràng
Hướng tối ưu hóa chiến lược
- Thêm bộ lọc biến động: có thể thêm ATR Threshold Judgment, tạm dừng giao dịch khi biến động quá lớn
- Tối ưu hóa cơ chế xác nhận tín hiệu: Có thể xem xét thêm các chỉ số phụ trợ như trung bình di chuyển để tăng độ tin cậy tín hiệu
- Cải thiện cơ chế dừng lỗ: đề xuất thêm chức năng theo dõi dừng lỗ để bảo vệ tốt hơn lợi nhuận đã thu được
- Tăng bộ lọc thời gian: có thể điều chỉnh các tham số chiến lược hoặc tạm dừng giao dịch theo đặc điểm thị trường trong các khoảng thời gian khác nhau
- Phát triển tham số thích ứng: Thiết kế cơ chế tham số thích ứng, điều chỉnh tham số chiến lược theo tình trạng thị trường động
Tóm tắt
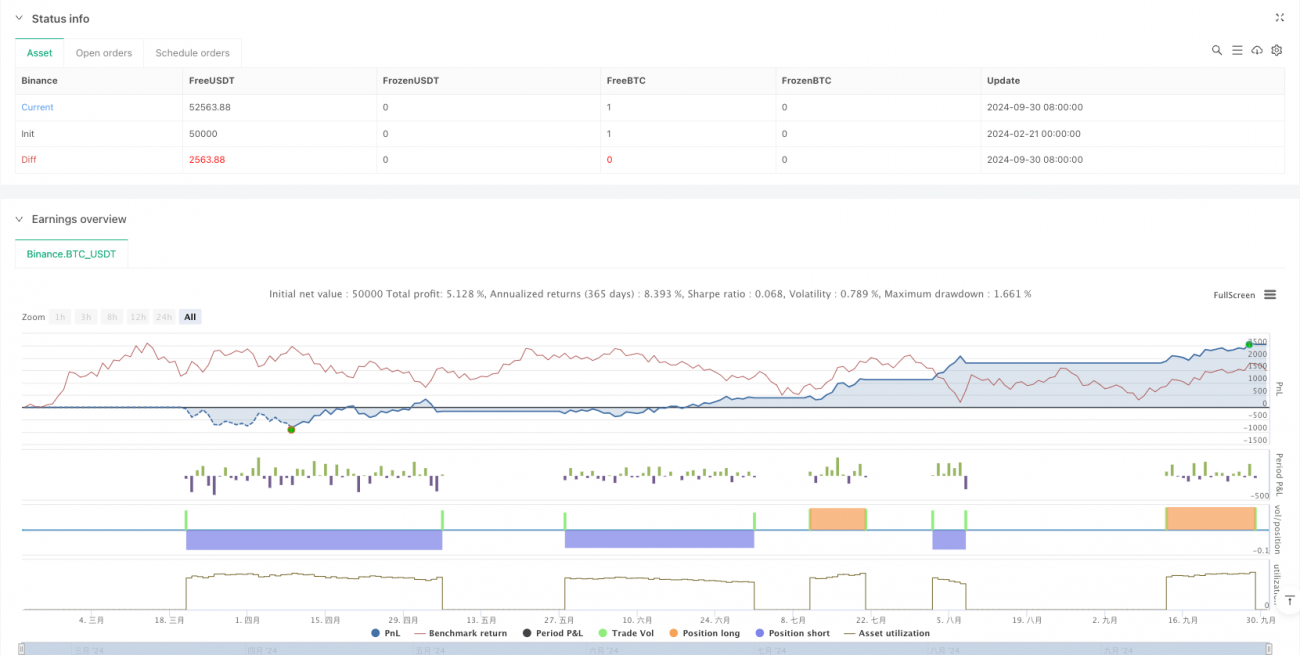
Chiến lược này kết hợp theo dõi xu hướng và phân tích động lực để xây dựng một hệ thống giao dịch hoàn chỉnh hơn. Nó không chỉ cung cấp tín hiệu nhập cảnh và xuất cảnh rõ ràng, mà còn bao gồm cả cơ sở quản lý rủi ro và tối ưu hóa tham số. Mặc dù có một số rủi ro vốn có, nhưng bằng cách cung cấp các đề xuất tối ưu hóa, bạn có thể nâng cao hơn nữa sự ổn định và thích ứng của chiến lược.
/*backtest
start: 2024-02-21 00:00:00
end: 2024-10-01 00:00:00
period: 2d
basePeriod: 2d
exchanges: [{"eid":"Binance","currency":"BTC_USDT"}]
*/

//@version=5
strategy("SuperTrend + Stochastic Strategy", overlay=true, default_qty_type=strategy.percent_of_equity, default_qty_value=10)

// SuperTrend Settings- 1