Chiến lược giao thoa đa chỉ báo thích ứng động kết hợp với hệ thống kiểm soát rủi ro thông minh SRSI và MACD

Tổng quan
Chiến lược này là một hệ thống giao dịch động kết hợp các chỉ số tương đối mạnh (SRSI) và xu hướng trung bình di chuyển / phân tán (MACD). Nó điều chỉnh động điểm dừng và điểm dừng thông qua chỉ số ATR, thực hiện quản lý thông minh về rủi ro. Cốt lõi của chiến lược này là tạo ra tín hiệu giao dịch thông qua xác nhận chéo của nhiều chỉ số kỹ thuật, đồng thời quản lý vị trí với biến động của thị trường.
Nguyên tắc chiến lược
Chiến lược hoạt động dựa trên các cơ chế cốt lõi sau:
- Xác định xu hướng thị trường bằng cách tính toán chênh lệch giữa đường K và đường D trong chỉ số SRSI, và giữa đường K và MACD thống nhất
- Điều kiện mua phải được đáp ứng cùng lúc: K-D chênh lệch là dương, K-MACD chênh lệch là dương, và MACD không có xu hướng giảm
- Điều kiện bán phải được đáp ứng đồng thời: K-D chênh lệch là âm, K-MACD chênh lệch là âm, và MACD không có xu hướng tăng
- Sử dụng ATR nhân với hệ số rủi ro để tính toán động khoảng cách dừng và dừng, điều chỉnh theo biến động của thị trường
Lợi thế chiến lược
- Cơ chế xác nhận đa tín hiệu làm tăng đáng kể độ tin cậy của giao dịch, tránh các tín hiệu sai mà chỉ số duy nhất có thể mang lại
- Cài đặt dừng lỗ động có thể tự động điều chỉnh theo biến động thị trường, cung cấp tỷ lệ lợi nhuận rủi ro tốt hơn
- Chiến lược có khả năng thích ứng tốt, có thể duy trì hiệu suất ổn định trong các môi trường thị trường khác nhau
- Các tham số có thể điều chỉnh được, cho phép các nhà giao dịch tối ưu hóa theo sở thích rủi ro cá nhân
Rủi ro chiến lược
- Có thể tạo ra quá nhiều tín hiệu giao dịch trong thị trường bất ổn, dẫn đến việc đi vào và ra khỏi thị trường thường xuyên
- Việc sử dụng nhiều chỉ số có thể gây ra sự chậm trễ tín hiệu, bỏ lỡ thời điểm tốt nhất để tham gia vào thị trường thay đổi nhanh chóng
- ATR dựa trên tính toán biến động lịch sử và có thể không thích ứng kịp thời khi thị trường biến động
- Cần thiết phải đặt các hệ số rủi ro hợp lý, quá lớn hoặc quá nhỏ có thể ảnh hưởng đến hiệu quả của chiến lược
Hướng tối ưu hóa chiến lược
- Thêm bộ lọc xu hướng, sử dụng tiêu chuẩn xác nhận tín hiệu khác nhau trong thị trường chấn động và thị trường xu hướng
- Tiến hành các chỉ số giao thông như hỗ trợ xác nhận, tăng độ tin cậy của tín hiệu
- Phương pháp tính toán tối ưu hóa dừng lỗ có thể được xem xét kết hợp với ngưỡng kháng cự hỗ trợ
- Tham gia mô hình dự đoán biến động thị trường, điều chỉnh các tham số rủi ro trước
- Cân nhắc xác nhận tín hiệu trên các chu kỳ thời gian khác nhau để tăng cường sự ổn định của chiến lược
Tóm tắt
Chiến lược này xây dựng một hệ thống giao dịch vững chắc bằng cách kết hợp các lợi thế của SRSI và MACD. Cơ chế quản lý rủi ro động giúp nó có khả năng thích ứng tốt, nhưng vẫn yêu cầu các nhà giao dịch tối ưu hóa các tham số theo tình hình thị trường thực tế. Chiến lược thành công cần có sự hiểu biết sâu sắc về thị trường và quản lý vị trí hợp lý kết hợp với khả năng chịu rủi ro của cá nhân.
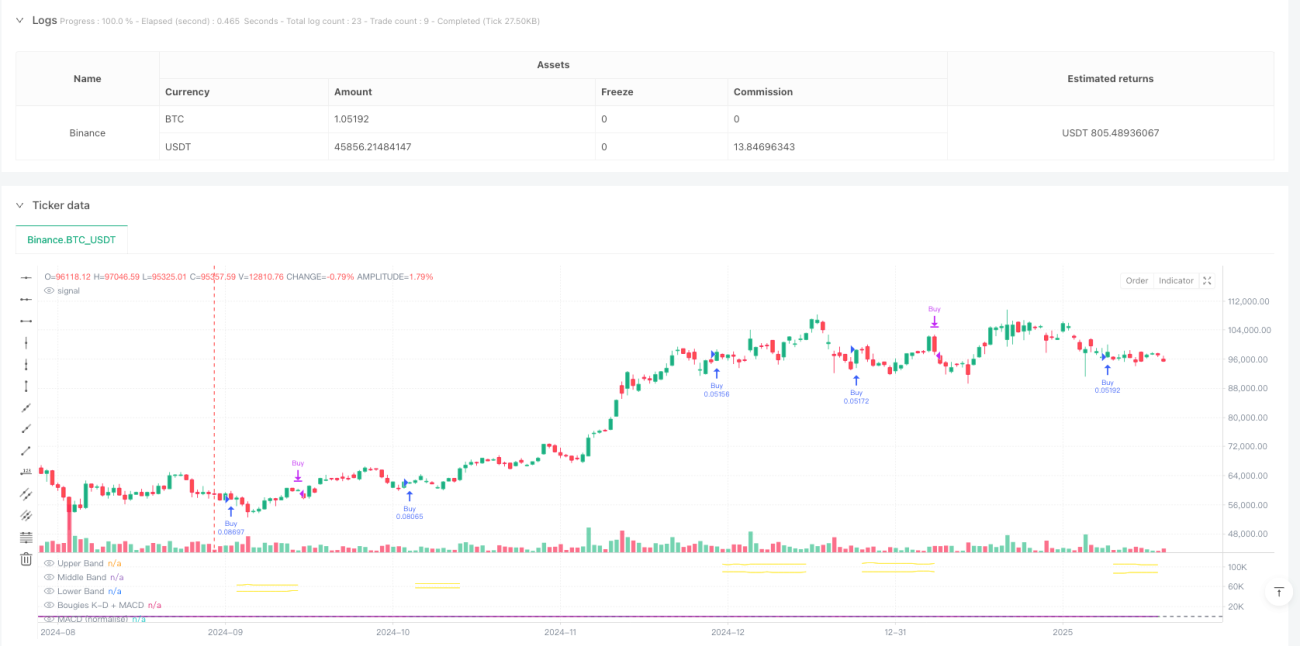
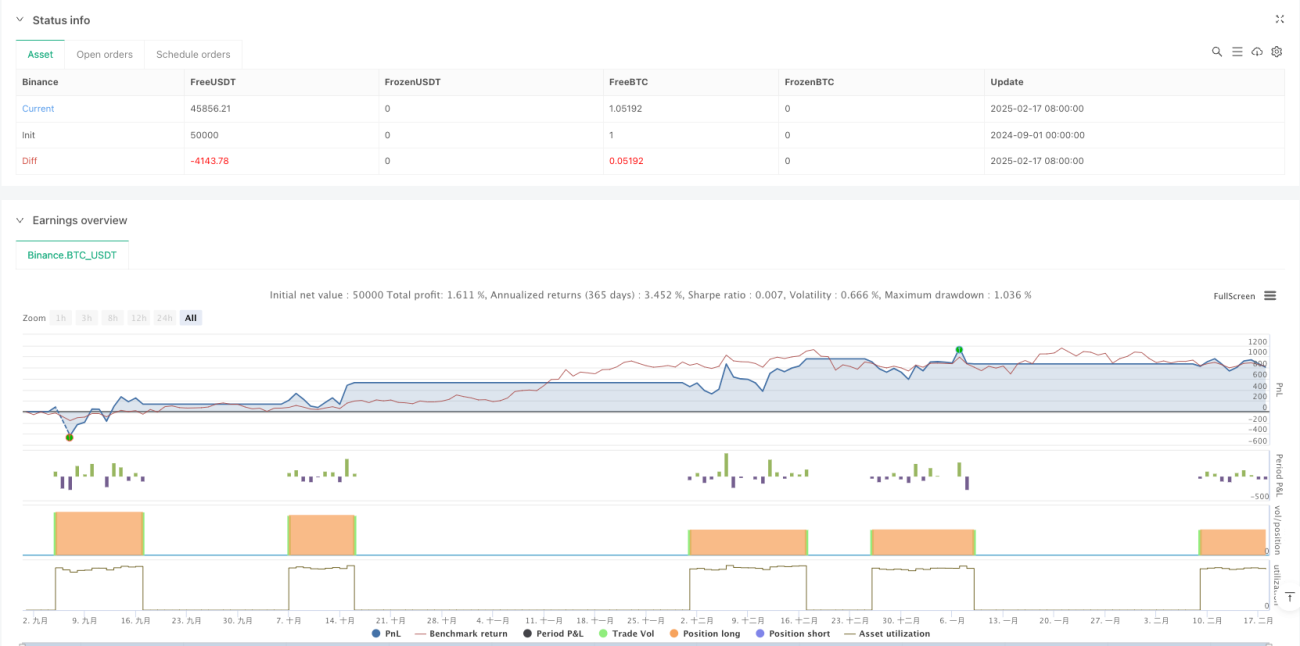
/*backtest
start: 2024-09-01 00:00:00
end: 2025-02-18 08:00:00
period: 1d
basePeriod: 1d
exchanges: [{"eid":"Binance","currency":"BTC_USDT"}]
*/

//@version=6
strategy(title="SRSI + MACD Strategy with Dynamic Stop-Loss and Take-Profit", shorttitle="SRSI + MACD Strategy", overlay=false, default_qty_type=strategy.percent_of_equity, default_qty_value=10)

// User Inputs- 1