Chiến lược dừng lỗ ATR theo động lượng Z kết hợp với tỷ lệ rủi ro-lợi nhuận để tối ưu hóa hệ thống giao dịch

Tổng quan
Chiến lược này là một hệ thống giao dịch hoàn chỉnh kết hợp nhiều chỉ số kỹ thuật, chủ yếu dựa trên điểm Z để đo lường số lượng giao dịch và giá trị bất thường về kích thước thực thể K-line, và sử dụng ATR để thiết lập điểm dừng động. Hệ thống cũng tích hợp tỷ lệ lợi nhuận rủi ro (RR) để tối ưu hóa mục tiêu lợi nhuận, cung cấp tín hiệu giao dịch đáng tin cậy thông qua phân tích kỹ thuật đa chiều.
Nguyên tắc chiến lược
Logic cốt lõi của chiến lược này dựa trên các thành phần chính sau:
- Phân tích Z-score: tính toán chênh lệch tiêu chuẩn giữa khối lượng giao dịch và các thực thể K-line để xác định hoạt động bất thường của thị trường
- Xác nhận xu hướng: xác nhận hướng xu hướng bằng cách phân tích các điểm cao và thấp của đường K và giá đóng cửa
- ATR Stop: sử dụng giá trị ATR động để thiết lập vị trí dừng để cung cấp kiểm soát rủi ro linh hoạt hơn
- Tỷ lệ lợi nhuận rủi ro: Tính toán mục tiêu lợi nhuận tự động dựa trên tỷ lệ RR đã đặt
- Hình ảnh đánh dấu: đánh dấu tín hiệu giao dịch và mức giá quan trọng trên biểu đồ
Lợi thế chiến lược
- Xác nhận tín hiệu đa chiều: kết hợp khối lượng giao dịch, động lực giá và hướng xu hướng để tăng độ tin cậy của tín hiệu giao dịch
- Quản lý rủi ro năng động: Tự thích nghi với biến động thị trường thông qua ATR
- Thiết lập tham số linh hoạt: cho phép điều chỉnh Z-score threshold, ATR và tỷ lệ lợi nhuận rủi ro
- Thời điểm chính xác để nhập: sử dụng Z-score để xác định các cơ hội giao dịch quan trọng
- Khả năng hiển thị rõ ràng: Điểm vào, điểm dừng và mục tiêu thu lợi nhuận được đánh dấu rõ ràng trên biểu đồ
Rủi ro chiến lược
- Tính nhạy cảm của tham số: Các thiết lập của ngưỡng điểm Z và ATR có ảnh hưởng trực tiếp đến tần suất giao dịch và kiểm soát rủi ro
- Tùy thuộc vào môi trường thị trường: tín hiệu giao dịch có thể ít hơn trong môi trường biến động thấp
- Tính phức tạp của tính toán: tính toán nhiều chỉ số có thể dẫn đến sự chậm trễ trong việc tạo tín hiệu
- Rủi ro trượt: Có thể đối mặt với sự lệch giữa giá thực hiện thực tế và giá tín hiệu trong thị trường nhanh
- Rủi ro phá vỡ giả: có thể gây ra tín hiệu phá vỡ sai trong thị trường.
Hướng tối ưu hóa chiến lược
- Bộ lọc môi trường thị trường: Thêm bộ lọc tỷ lệ biến động thị trường, điều chỉnh các tham số động theo môi trường thị trường khác nhau
- Cơ chế xác nhận tín hiệu: giới thiệu thêm các chỉ số kỹ thuật để kiểm tra chéo, chẳng hạn như RSI hoặc MACD
- Tối ưu hóa quản lý vị trí: Điều chỉnh vị trí động dựa trên biến động và rủi ro tài khoản
- Phân tích nhiều chu kỳ thời gian: xác nhận xu hướng tích hợp các chu kỳ thời gian cao hơn, tăng tỷ lệ thành công giao dịch
- Tối ưu hóa lọc tín hiệu: thêm các điều kiện lọc bổ sung để giảm tín hiệu giả
Tóm tắt
Chiến lược này xây dựng một hệ thống giao dịch hoàn chỉnh bằng cách kết hợp phân tích Z-score, ATR dừng lỗ và tối ưu hóa tỷ lệ lợi nhuận rủi ro. Điểm mạnh của hệ thống là xác nhận tín hiệu đa chiều và quản lý rủi ro linh hoạt, nhưng vẫn cần chú ý đến các tác động của cài đặt tham số và môi trường thị trường.
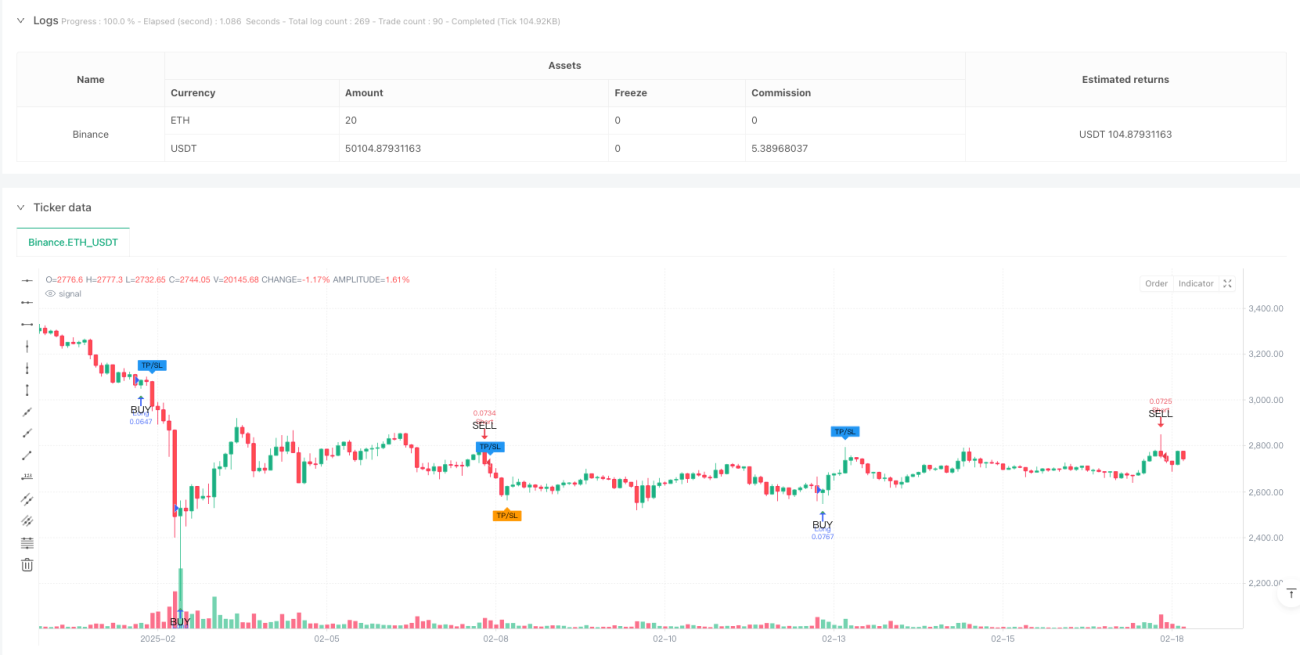
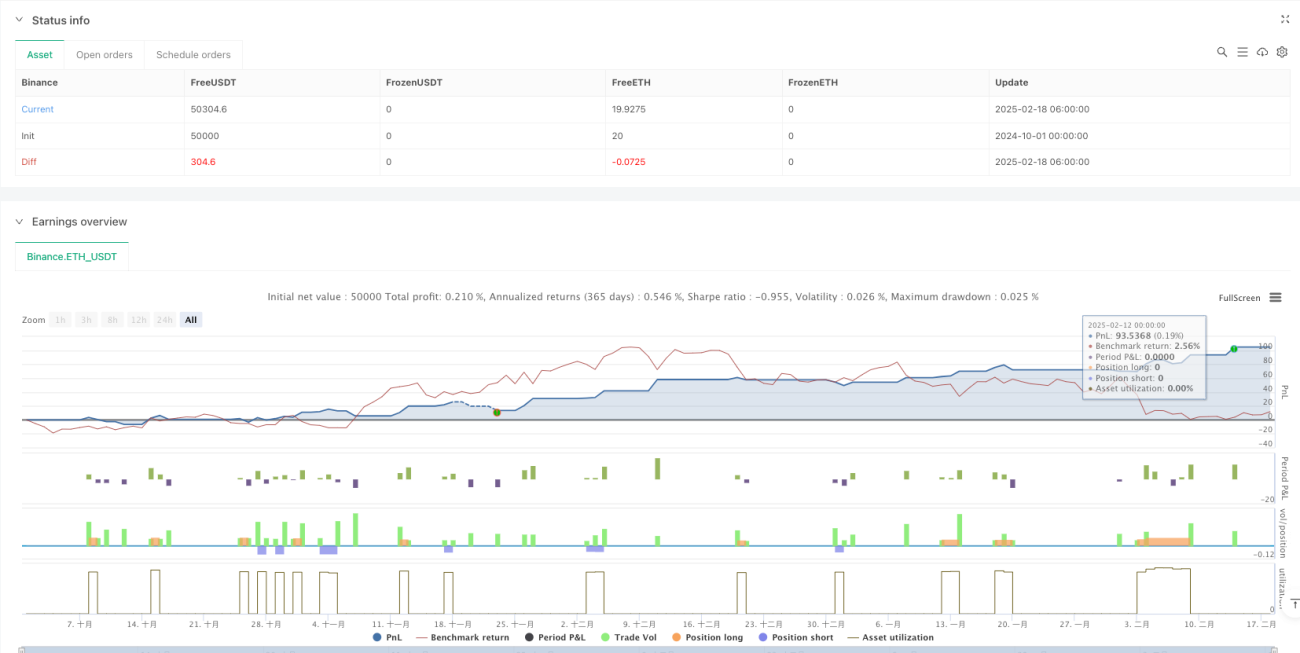
/*backtest
start: 2024-10-01 00:00:00
end: 2025-02-18 08:00:00
period: 2h
basePeriod: 2h
exchanges: [{"eid":"Binance","currency":"ETH_USDT"}]
*/

//@version=5
strategy("admbrk | Candle Color & Price Alarm with ATR Stop", overlay=true, initial_capital=50, default_qty_type=strategy.cash, default_qty_value=200, commission_type=strategy.commission.percent, commission_value=0.05, pyramiding=3)

// **Risk/Reward ratio (RR) as input**- 1