Chiến lược giao dịch chỉ báo kép ngẫu nhiên SuperTrend-Stochastic được tăng cường động lượng

2
Follow
478
Followers
Tổng quan
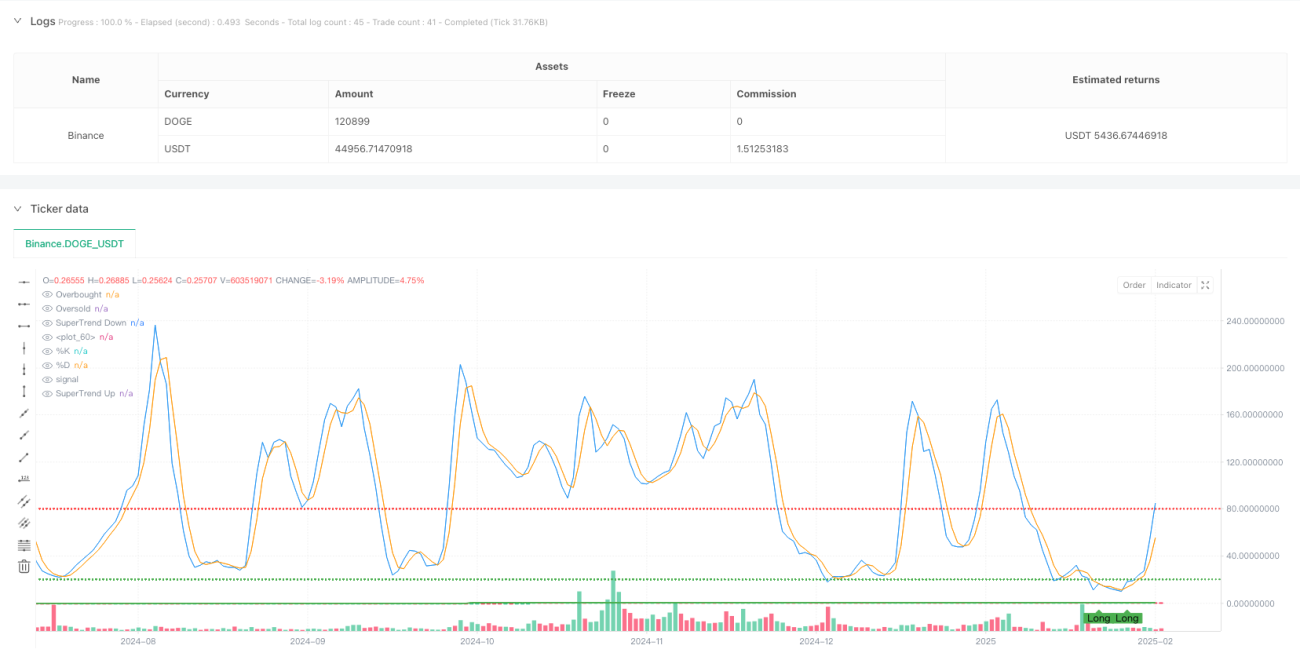
Đây là một chiến lược giao dịch phức hợp kết hợp chỉ số SuperTrend và Stochastic Oscillator. Chiến lược này sử dụng chỉ số SuperTrend để xác định hướng xu hướng thị trường, đồng thời sử dụng chỉ số Stochastic để xác nhận động lực giá, để tạo ra tín hiệu giao dịch chính xác hơn. Chiến lược sử dụng ATR (trung bình real amplitude) làm tham chiếu biến động, theo dõi xu hướng bằng cách điều chỉnh động lực hỗ trợ / kháng cự.
Nguyên tắc chiến lược
Lập luận cốt lõi của chiến lược dựa trên một số thành phần quan trọng sau:
- Chỉ số SuperTrend sử dụng 10 chu kỳ ATR và 3.0 lần tính toán động hỗ trợ kháng cự kênh
- Chỉ số biến động ngẫu nhiên sử dụng các tham số cổ điển ([14,3,3]) để xác định khu vực quá mua quá bán
- Một số điều kiện được yêu cầu:
- SuperTrend cho thấy xu hướng giảm giá
- Chỉ số ngẫu nhiên % K trên đường % D
- % K nằm trong khu vực bán tháo (< 20)
- Yêu cầu về điều kiện không khí:
- SuperTrend cho thấy xu hướng giảm
- Chỉ số ngẫu nhiên %K đi qua %D
- % K ở vùng mua quá mức (<80)
Lợi thế chiến lược
- Kết hợp theo dõi xu hướng và xác nhận động lực, tăng đáng kể độ tin cậy của tín hiệu giao dịch
- Sử dụng ATR để điều chỉnh chiều rộng kênh SuperTrend một cách động để thích ứng tốt hơn với sự biến động của thị trường
- Tránh giao dịch đối kháng ở các vùng cực bằng cách lọc quá mua quá bán của chỉ số ngẫu nhiên
- Các điều kiện tín hiệu nghiêm ngặt, có thể lọc hiệu quả phá vỡ giả, giảm tín hiệu giả
- Chiến lược logic rõ ràng, tham số có thể điều chỉnh được, phù hợp với các môi trường thị trường khác nhau
Rủi ro chiến lược
- Có thể tạo ra quá nhiều tín hiệu giao dịch trong thị trường bất ổn, làm tăng chi phí giao dịch
- Điều kiện tín hiệu quá nghiêm ngặt có thể bỏ lỡ một số cơ hội giao dịch tiềm năng
- Chỉ số SuperTrend có thể bị tụt hậu khi dao động mạnh
- Các chỉ số ngẫu nhiên có thể đưa ra tín hiệu đảo ngược sớm trong thị trường xu hướng mạnh
Các biện pháp kiểm soát rủi ro sau đây được đề xuất:
- Đặt điểm dừng lỗ hợp lý
- Xem xét thêm bộ lọc cường độ xu hướng (như ADX)
- Các tham số điều chỉnh theo môi trường thị trường
Hướng tối ưu hóa chiến lược
- Lập các chỉ số cường độ xu hướng (như ADX) để lọc giao dịch tối ưu hóa:
- Chỉ mở đầu tư khi xu hướng rõ ràng
- Những giao dịch thường xuyên có thể tránh được sự biến động của thị trường
- Tối ưu hóa tham số chỉ số ngẫu nhiên:
- Cân nhắc chu kỳ thích ứng
- Chuyển đổi theo biến động của tỷ lệ
- Cải thiện hệ thống quản lý tài chính:
- Định vị dừng động dựa trên ATR
- Động lực điều chỉnh mục tiêu lợi nhuận
- Thêm tính năng lọc thời gian:
- Tránh thời điểm thiếu thanh khoản
- Ngừng giao dịch trước khi công bố dữ liệu quan trọng
Tóm tắt
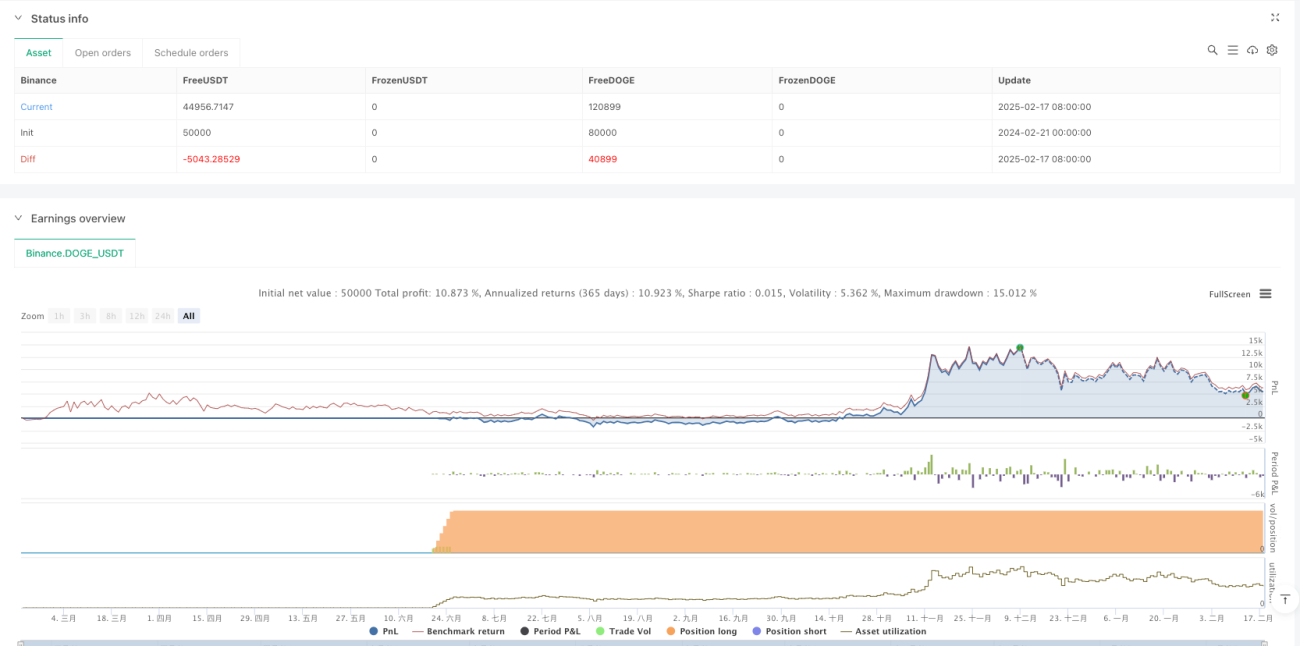
Chiến lược này thực hiện sự kết hợp hữu cơ của theo dõi xu hướng và xác nhận động lực bằng cách kết hợp với chỉ số SuperTrend và biến động ngẫu nhiên. Chiến lược được thiết kế hợp lý, có khả năng điều chỉnh và thích ứng tốt.
Source
Pine
/*backtest
start: 2024-02-21 00:00:00
end: 2025-02-18 08:00:00
period: 1d
basePeriod: 1d
exchanges: [{"eid":"Binance","currency":"DOGE_USDT"}]
*/

//@version=5
strategy("SuperTrend + Stochastic Strategy", overlay=true, default_qty_type=strategy.percent_of_equity, default_qty_value=10)

// === Vstupy ===Strategy parameters
Related strategies
Comment
All comments (0)
No data
- 1