Đường trung bình động kép giao cắt kết hợp với chiến lược giao dịch lọc điểm mạnh và điểm yếu của RSI

Dual Moving Average Crossover with RSI Strength Filter Trading Strategy Chiến lược giao dịch
Tổng quan
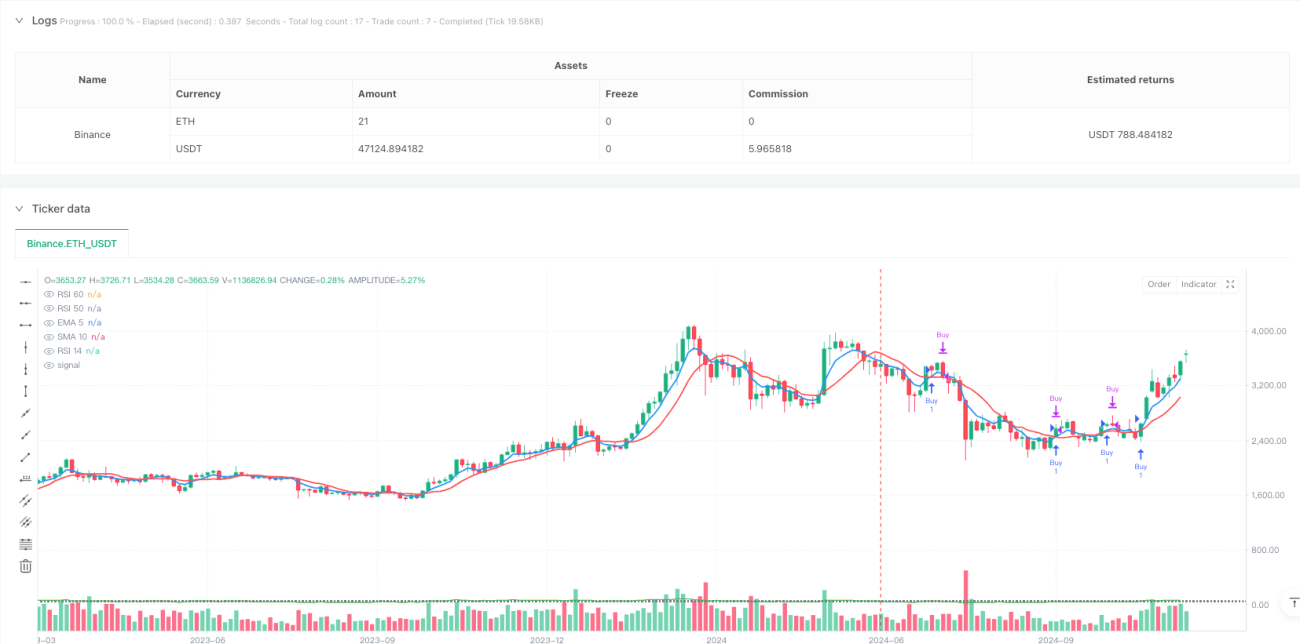
Chiến lược này là một hệ thống giao dịch kết hợp các bộ lọc chỉ số crossover và RSI. Chiến lược sử dụng chỉ số chuyển động 5 chu kỳ ((EMA5) và chỉ số chuyển động đơn giản 10 chu kỳ ((SMA10) như là công cụ định hướng chính, đồng thời giới thiệu chỉ số tương đối mạnh 14 chu kỳ ((RSI14) như là bộ lọc tín hiệu giao dịch, để tăng độ chính xác của giao dịch thông qua các điều kiện vào và ra nghiêm ngặt.
Nguyên tắc chiến lược
Lập luận cốt lõi của chiến lược dựa trên sự kết hợp của hai chỉ số kỹ thuật quan trọng:
- Hệ thống hai đường: giao chéo giữa EMA5 và SMA10 để nắm bắt sự thay đổi xu hướng
- Khi EMA5 đi lên qua SMA10, tạo ra tín hiệu đa
- Khi EMA5 đi xuống qua SMA10, tạo ra tín hiệu trống
- Hệ thống lọc RSI:
- Làm nhiều điều kiện yêu cầu RSI 14 lớn hơn 60
- Điều kiện làm trống yêu cầu RSI 14 nhỏ hơn 50
- Giá phải vượt qua RSI để xác nhận tín hiệu giao dịch
Lợi thế chiến lược
-
Cơ chế xác nhận tín hiệu hoàn thiện
- Tín hiệu ban đầu được cung cấp thông qua giao thoa hai đường bằng nhau
- Xác nhận thứ hai bằng bộ lọc RSI
- Yêu cầu giá phá vỡ mức quan trọng RSI như xác nhận cuối cùng
-
Kiểm soát rủi ro hiệu quả
- Điều kiện nhập cảnh và xuất cảnh rõ ràng
- Cơ chế thanh toán tự động bằng tín hiệu ngược
- Chỉ số RSI lọc các tín hiệu giả mạo tiềm ẩn
-
Chiến lược logic rõ ràng
- Hộp chỉ số đơn giản và dễ hiểu
- Các quy tắc giao dịch rõ ràng
- Điều chỉnh và tối ưu hóa
Rủi ro chiến lược
-
Rủi ro của thị trường biến động
- Sự giao thoa thường xuyên có thể dẫn đến giao dịch quá mức
- Có thể có tín hiệu sai lệch trong thị trường ngang
- Khuyến nghị sử dụng trong xu hướng rõ ràng
-
Rủi ro của sự chậm trễ
- Đường trung bình di chuyển tự nó có tính chậm trễ.
- RSI xác nhận có thể dẫn đến việc bỏ lỡ một số hoạt động
- Cần tìm sự cân bằng giữa kịp thời và chính xác
-
Độ nhạy tham số
- Cài đặt chu kỳ trung bình ảnh hưởng đến tần số tín hiệu
- RSI thiết lập ngưỡng ảnh hưởng đến hiệu quả lọc
- Các môi trường thị trường khác nhau có thể yêu cầu các tham số khác nhau
Hướng tối ưu hóa chiến lược
-
Tiếp theo, bạn có thể sử dụng một bộ lọc theo xu hướng.
- Tăng cường đánh giá xu hướng của chỉ số ADX
- Sử dụng các điều kiện lọc RSI thoải mái hơn trong xu hướng mạnh
- Tăng độ nghiêm ngặt trong điều kiện lọc trong xu hướng yếu
-
Các tham số tối ưu hóa tự điều chỉnh
- Chu kỳ đường trung bình được điều chỉnh theo biến động của thị trường
- Tự động điều chỉnh RSI dựa trên môi trường thị trường
- Nhập các tùy chọn tham số tối ưu hóa thuật toán thích ứng
-
Quản lý rủi ro tốt hơn
- Thêm hệ thống chống hỏng
- Thực hiện chức năng quản lý vị trí
- Thêm chi phí giao dịch
Tóm tắt
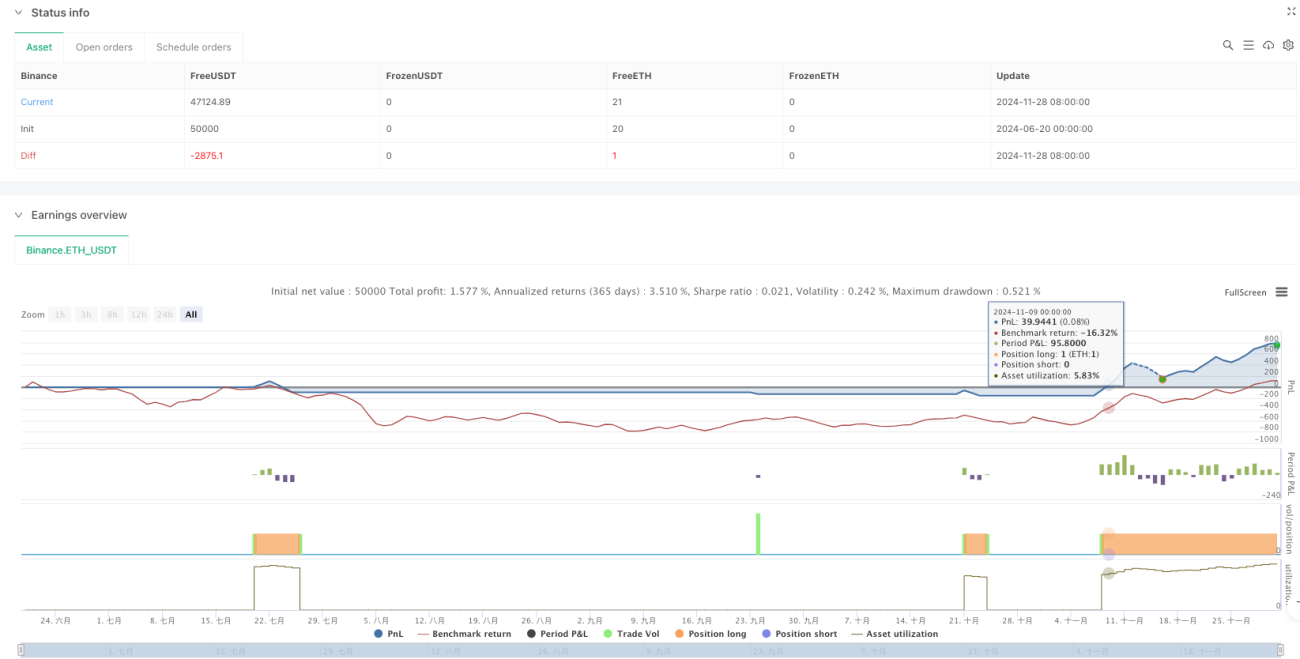
Chiến lược này được xây dựng một hệ thống giao dịch tương đối hoàn hảo bằng cách kết hợp các bộ lọc crossover và RSI. Lợi thế chính của chiến lược là cơ chế xác nhận tín hiệu và các biện pháp kiểm soát rủi ro, nhưng cũng có một số hạn chế vốn có. Với hướng tối ưu hóa được đề xuất, chiến lược có khả năng hoạt động tốt hơn trong giao dịch thực tế.
- 1