
2
Follow
478
Followers
Tổng quan
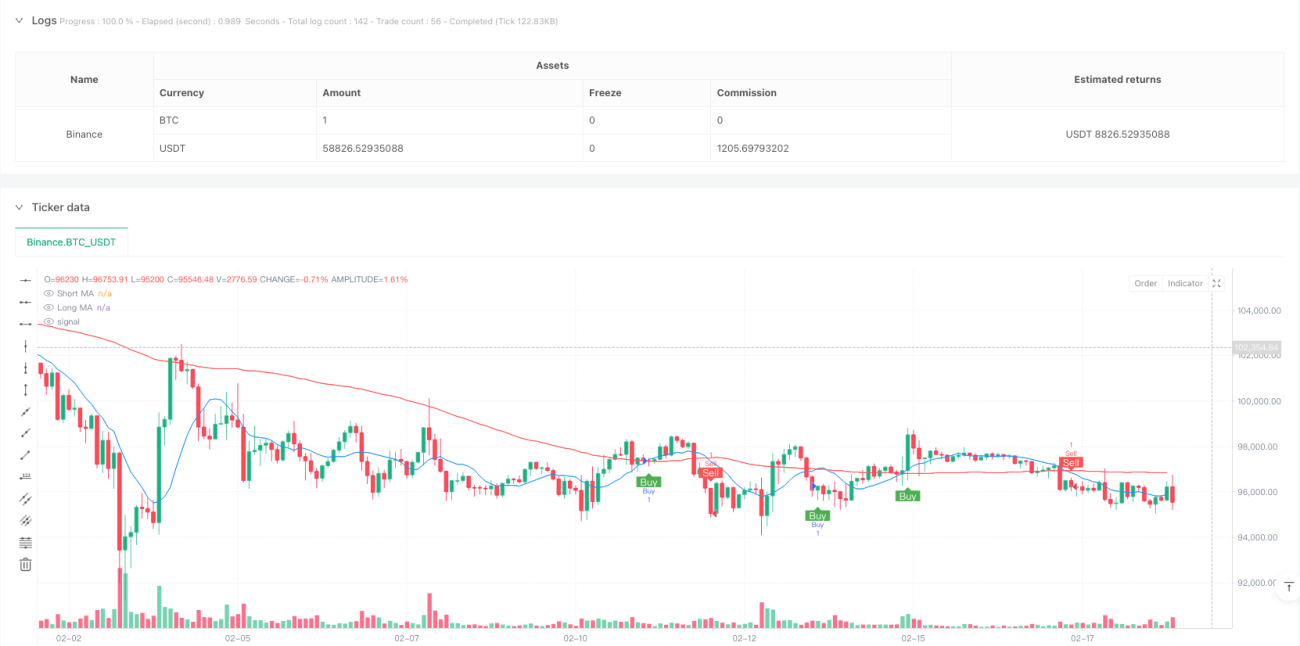
Chiến lược này là một hệ thống giao dịch kết hợp các tín hiệu giao dịch và quản lý rủi ro động. Nó tạo ra tín hiệu giao dịch bằng cách giao dịch giữa các đường trung bình di chuyển ngắn hạn và dài hạn, đồng thời sử dụng các chỉ số ATR để điều chỉnh các điểm dừng và lợi nhuận một cách động, và giới thiệu thời gian lọc và thời gian nguội để tối ưu hóa chất lượng giao dịch.
Nguyên tắc chiến lược
Chiến lược này dựa trên các thành phần cốt lõi sau:
- Hệ thống tạo tín hiệu sử dụng chéo trung bình di chuyển đơn giản ngắn hạn (khoảng 10 chu kỳ) và dài hạn (khoảng 100 chu kỳ) để kích hoạt giao dịch. Khi đường trung bình ngắn hạn đi lên trên đường trung bình dài hạn, nó tạo ra tín hiệu đa và ngược lại tạo ra tín hiệu ngắn hạn.
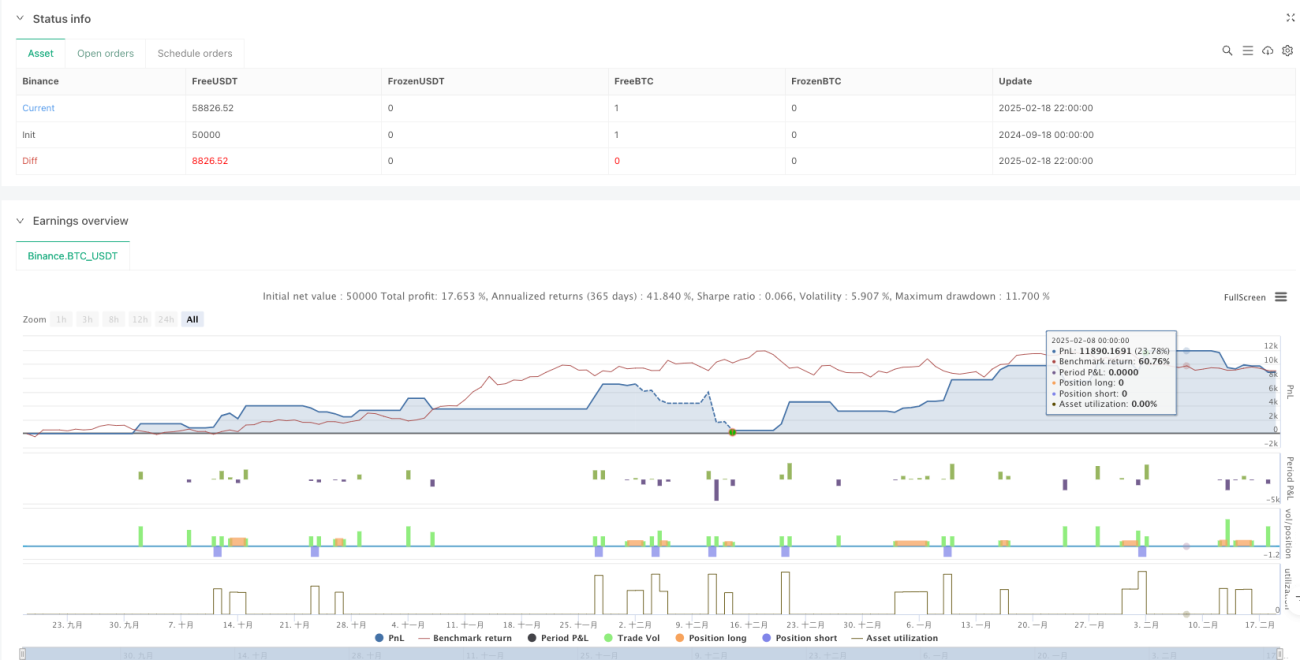
- Hệ thống quản lý rủi ro sử dụng ATR 14 chu kỳ nhân với hệ số 1.5 để thiết lập khoảng cách dừng lỗ động, và mục tiêu thu lợi nhuận là 2 lần khoảng cách dừng lỗ (tỷ lệ lợi nhuận rủi ro có thể điều chỉnh).
- Bộ lọc thời gian cho phép người dùng đặt thời gian cụ thể cho giao dịch, chỉ thực hiện giao dịch trong khoảng thời gian được chỉ định.
- Cơ chế thời gian làm mát giao dịch được thiết lập với thời gian chờ 10 chu kỳ để ngăn chặn giao dịch quá mức.
- Rủi ro của mỗi giao dịch được kiểm soát trong 1% của tài khoản (có thể điều chỉnh) <unk>
Lợi thế chiến lược
- Quản lý rủi ro động: Sử dụng chỉ số ATR để thích ứng với sự biến động của thị trường, tự động điều chỉnh khoảng cách dừng lỗ và thu lợi nhuận trong các môi trường thị trường khác nhau.
- Kiểm soát rủi ro đầy đủ: Thực hiện quản lý tiền một cách có hệ thống bằng cách thiết lập tỷ lệ lợi nhuận rủi ro và tỷ lệ rủi ro cho mỗi giao dịch.
- Quản lý thời gian linh hoạt: Thời gian giao dịch có thể được điều chỉnh theo các đặc điểm của thời gian giao dịch của các thị trường khác nhau.
- Chống giao dịch quá mức: Cơ chế thời gian nguội có hiệu quả trong việc tránh quá nhiều tín hiệu giao dịch trong thời gian biến động mạnh.
- Hiệu ứng trực quan: Hiển thị rõ ràng các tín hiệu giao dịch và đường trung bình di chuyển trên biểu đồ, giúp phân tích và tối ưu hóa.
Rủi ro chiến lược
- Rủi ro đảo ngược xu hướng: Có thể tạo ra tín hiệu phá vỡ giả trong thị trường biến động, dẫn đến tổn thất liên tục.
- Tính nhạy cảm của tham số: Việc lựa chọn các tham số như chu kỳ trung bình di chuyển, ATR nhân có thể ảnh hưởng đáng kể đến hiệu suất của chiến lược.
- Nếu bạn đặt bộ lọc thời gian sai, bạn có thể bỏ lỡ cơ hội giao dịch quan trọng.
- Tỷ lệ lợi nhuận rủi ro cố định có thể không đủ linh hoạt trong các môi trường thị trường khác nhau.
Hướng tối ưu hóa chiến lược
- Thêm bộ lọc cường độ xu hướng: Bạn có thể thêm ADX hoặc các chỉ số tương tự để đánh giá cường độ của xu hướng, chỉ giao dịch khi xu hướng mạnh.
- Tỷ lệ lợi nhuận rủi ro điều chỉnh động: Tỷ lệ lợi nhuận rủi ro điều chỉnh tự động theo biến động thị trường hoặc cường độ của xu hướng.
- Tăng phân tích khối lượng giao dịch: Sử dụng khối lượng giao dịch như một chỉ số bổ sung để xác nhận tín hiệu.
- Cơ chế tối ưu hóa thời gian làm mát: cho phép thời gian làm mát được điều chỉnh theo động lực biến động của thị trường.
- Thêm phân loại môi trường thị trường: Sử dụng các tổ hợp tham số khác nhau trong các môi trường thị trường khác nhau.
Tóm tắt
Chiến lược này xây dựng một hệ thống giao dịch hoàn chỉnh bằng cách kết hợp các phương pháp phân tích kỹ thuật cổ điển và các khái niệm quản lý rủi ro hiện đại. Ưu điểm cốt lõi của nó là quản lý rủi ro động và cơ chế lọc nhiều, nhưng vẫn cần tối ưu hóa tham số theo đặc điểm thị trường cụ thể trong ứng dụng thực tế.
Source
Pine
/*backtest
start: 2024-09-18 00:00:00
end: 2025-02-19 00:00:00
period: 2h
basePeriod: 2h
exchanges: [{"eid":"Binance","currency":"BTC_USDT"}]
*/

//@version=5
strategy("Profitable Moving Average Crossover Strategy", shorttitle="Profitable MA Crossover", overlay=true)

// Input parameters for the moving averagesStrategy parameters
Related strategies
Comment
All comments (0)
No data
- 1