
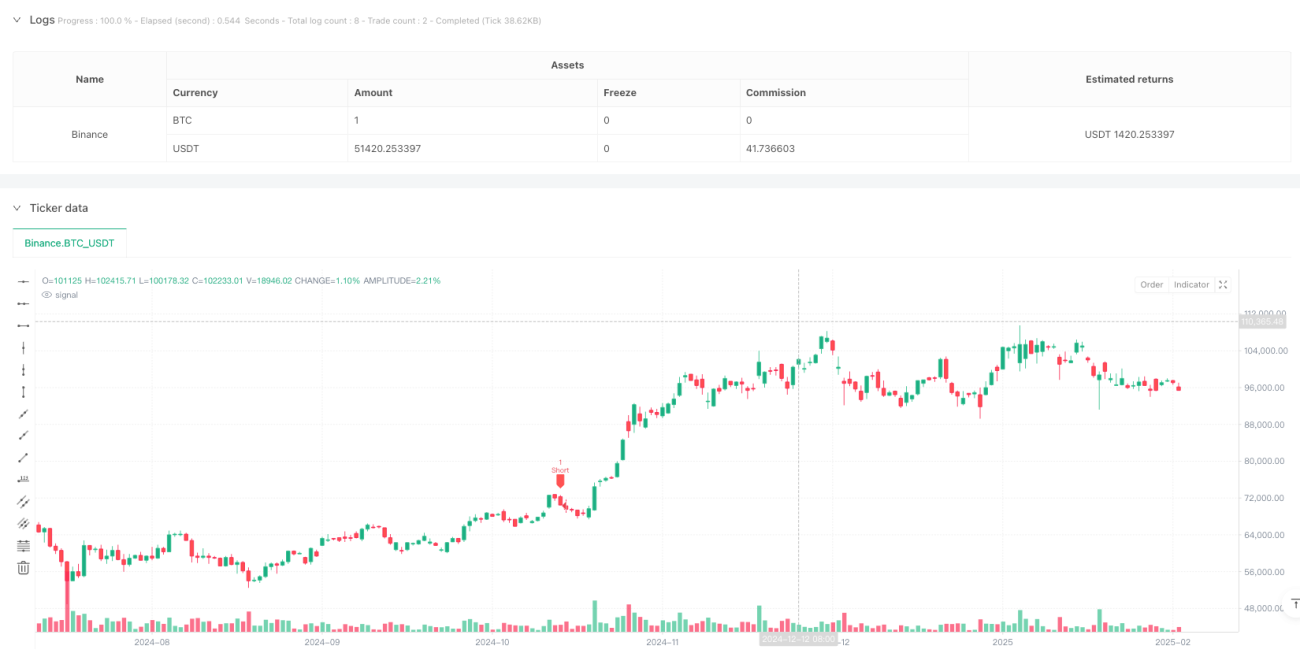
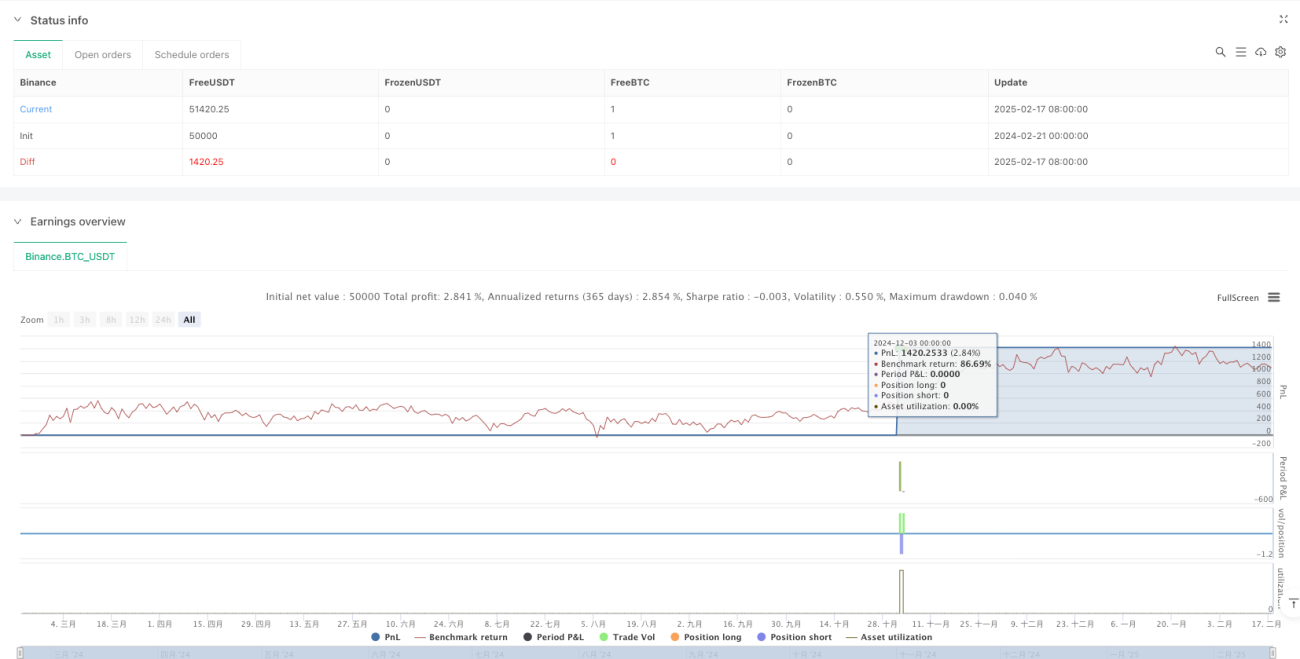
Tổng quan
Chiến lược này là một hệ thống giao dịch băng tần nhiều khung thời gian dựa trên chỉ số ngẫu nhiên Stochastic Oscillator. Nó xác định cơ hội giao dịch bằng cách kết hợp các tín hiệu chỉ số ngẫu nhiên của khung thời gian hiện tại và khung thời gian cao hơn và sử dụng dừng dừng động để quản lý rủi ro. Chiến lược này phù hợp với thị trường có nhiều biến động, thu lợi nhuận bằng cách nắm bắt biến động ngắn hạn của giá.
Nguyên tắc chiến lược
Logic cốt lõi của chiến lược này dựa trên các yếu tố chính sau:
- Sử dụng chỉ số ngẫu nhiên để xác nhận tín hiệu trên hai khung thời gian (của hiện tại và cấp cao hơn)
- Tìm dấu hiệu giao lộ ở khu vực mua bán quá mức
- Điều kiện mua: Dọc D trên đường K trong khung thời gian hiện tại và giá trị K < 20; khung thời gian cao hơn K < 20 và K> D
- Điều kiện bán: Dọc D dưới K trong khung thời gian hiện tại và K> 80; khung thời gian cao hơn K> 80 và K < D
- Sử dụng hệ thống dừng động dựa trên giá vào, có thể điều chỉnh nhân số dừng
Lợi thế chiến lược
- Các tín hiệu khung thời gian đa dạng xác nhận tăng độ tin cậy giao dịch và giảm hiệu quả các tín hiệu giả
- Giao dịch trong khu vực mua quá mức làm tăng khả năng đảo ngược xu hướng
- Hệ thống dừng lỗ động có thể tự động điều chỉnh theo biến động của thị trường, tăng tính linh hoạt trong quản lý tiền
- Giao diện đồ họa hiển thị trực quan các tín hiệu giao dịch và vị trí dừng lỗ để người giao dịch dễ hiểu và hoạt động
- Các tham số chiến lược có thể điều chỉnh để thích ứng với các môi trường thị trường khác nhau
Rủi ro chiến lược
- Các trường hợp có thể xảy ra dừng lỗ thường xuyên trong thị trường biến động mạnh
- Xác nhận khung thời gian kép có thể khiến bạn bỏ lỡ cơ hội giao dịch
- Lệnh dừng lỗ với số nhân cố định có thể không phù hợp với tất cả các điều kiện thị trường
- Có thể dừng lại quá sớm khi xu hướng mạnh
- Cần thiết lập các tham số hợp lý để cân bằng lợi nhuận và rủi ro
Hướng tối ưu hóa chiến lược
- Tiến hành cơ chế dừng lỗ thích ứng, điều chỉnh động theo biến động thị trường
- Thêm bộ lọc xu hướng, điều chỉnh hướng giao dịch trong xu hướng mạnh
- Thêm chỉ số giao dịch làm tín hiệu xác nhận phụ trợ
- Phát triển hệ thống quản lý kho thông minh hơn
- Xem xét thêm các chỉ số cảm xúc thị trường để tối ưu hóa thời gian đầu tư
Tóm tắt
Đây là một hệ thống giao dịch hoàn chỉnh kết hợp phân tích kỹ thuật và quản lý rủi ro. Chiến lược này có tiềm năng lợi nhuận tốt trong khi đảm bảo sự ổn định thông qua xác nhận tín hiệu và dừng lỗ động trong nhiều khung thời gian. Tuy nhiên, người dùng cần tối ưu hóa các tham số theo phong cách giao dịch và môi trường thị trường của mình và luôn luôn kiểm soát rủi ro nghiêm ngặt.
- 1