Chiến lược tổng hợp theo dõi xu hướng đa thời gian thích ứng động và đảo ngược cú sốc

Tổng quan
Chiến lược này là một hệ thống giao dịch phức tạp kết hợp theo dõi xu hướng và giao dịch trong khoảng thời gian, xác định trạng thái thị trường thông qua biểu đồ đám mây ichimoku, kết hợp với xác nhận động lực MACD và chỉ số bán tháo RSI, đồng thời sử dụng ATR để quản lý lỗ hổng động. Chiến lược này có thể nắm bắt cơ hội xu hướng trong thị trường xu hướng, tìm kiếm cơ hội đảo ngược trong thị trường biến động, có khả năng thích ứng và linh hoạt hơn.
Nguyên tắc chiến lược
Chiến lược sử dụng cơ chế xác nhận tín hiệu nhiều cấp:
- Sử dụng biểu đồ đám mây Ichimoku làm cơ sở phán đoán chính về tình trạng thị trường, để xác định thị trường có đang có xu hướng hay đang trong trạng thái chấn động thông qua mối quan hệ giữa giá và vị trí của đám mây
- Trong thị trường xu hướng, khi giá nằm trên đám mây và RSI> 55 và MACD là tích cực, hãy mua nhiều; khi giá nằm dưới đám mây và RSI<45 và MACD là âm, hãy mua trống
- Trong thị trường chấn động, khi RSI < 30 và RSI < 20 ngẫu nhiên, tìm kiếm cơ hội giao dịch nhiều; khi RSI > 70 và RSI ngẫu nhiên > 80, tìm kiếm cơ hội giao dịch ngắn hạn
- Sử dụng dừng động dựa trên ATR để quản lý rủi ro với khoảng cách dừng gấp 2 lần giá trị ATR
Lợi thế chiến lược
- Thị trường thích ứng mạnh: có thể tự động điều chỉnh chiến lược giao dịch theo các tình trạng thị trường khác nhau, tăng sự ổn định của chiến lược
- Tín hiệu đáng tin cậy cao: Sử dụng cơ chế xác minh đa chỉ số để giảm tác động của tín hiệu giả
- Kiểm soát rủi ro hoàn hảo: Bằng cách dừng lỗ động, ATR cho phép lợi nhuận phát triển đầy đủ và kiểm soát rủi ro hiệu quả
- Hiển thị hiệu quả tốt: Đánh dấu tình trạng thị trường bằng màu nền, giúp thương nhân hiểu trực quan môi trường thị trường
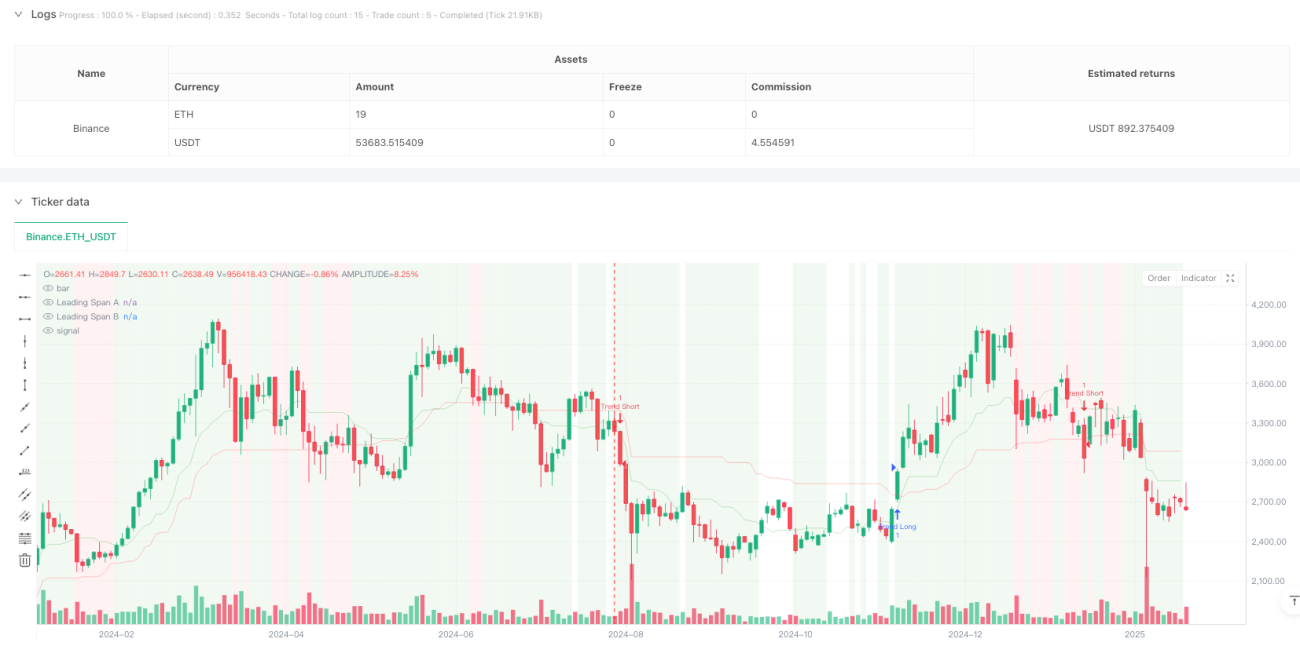
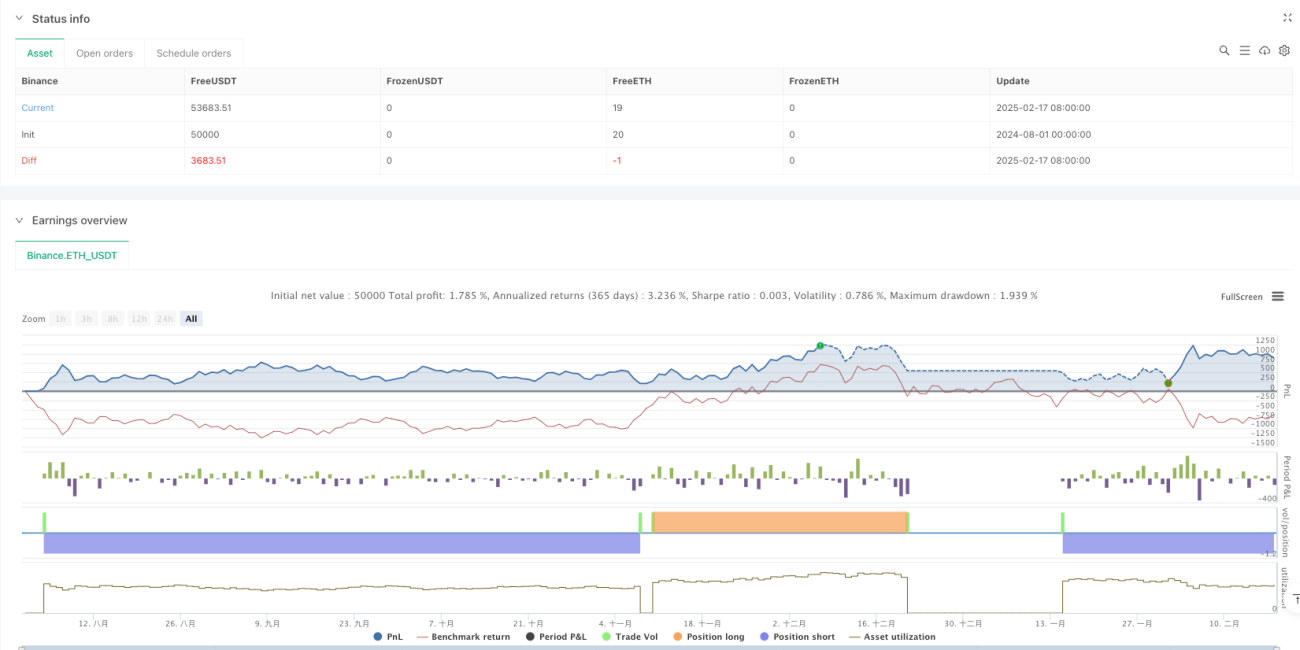
- Hiệu suất thời gian cao: có hệ số lợi nhuận 2.159 trên chu kỳ mặt trời, lợi nhuận ròng đạt 10.71%
Rủi ro chiến lược
- Tỷ lệ thành công thấp: Tỷ lệ thành công dưới 40% trong các chu kỳ thời gian khác nhau, đòi hỏi khả năng chịu đựng tinh thần mạnh mẽ
- Giao dịch quá mức trong chu kỳ thời gian thấp: 430 giao dịch được thực hiện trong chu kỳ 4 giờ, hiệu quả thấp
- Tín hiệu chậm trễ: Có thể bỏ lỡ một số cơ hội thị trường do sử dụng xác thực đa chỉ số
- Khó tối ưu hóa tham số: Sự kết hợp của nhiều chỉ số làm tăng sự phức tạp trong việc tối ưu hóa chiến lược
Hướng tối ưu hóa chiến lược
- Tối ưu hóa lọc tín hiệu: có thể tăng tỷ lệ thắng bằng cách điều chỉnh các điểm mốc của các chỉ số
- Chu kỳ thời gian thích ứng: khuyến nghị sử dụng chủ yếu trong chu kỳ mặt trời và trên, có thể điều chỉnh tham số theo các đặc điểm thị trường khác nhau
- Tối ưu hóa Stop Loss: Có thể xem xét điều chỉnh ATR theo các biến động khác nhau của thị trường
- Tối ưu hóa thời gian nhập cảnh: có thể thêm xác nhận khối lượng giao hàng hoặc xác nhận hình thức giá để tăng độ chính xác nhập cảnh
- Tối ưu hóa quản lý vị trí: có thể thiết kế hệ thống quản lý vị trí động dựa trên cường độ tín hiệu
Tóm tắt
Chiến lược này là một hệ thống giao dịch tổng hợp được thiết kế hợp lý, logic rõ ràng, thông qua việc sử dụng nhiều chỉ số kết hợp, nhận dạng thông minh về tình trạng thị trường và nắm bắt chính xác cơ hội giao dịch. Mặc dù có một số vấn đề trong chu kỳ thời gian thấp, nhưng hoạt động tốt hơn trong chu kỳ thời gian cao hơn như đường nhịp.
- 1