
Tổng quan
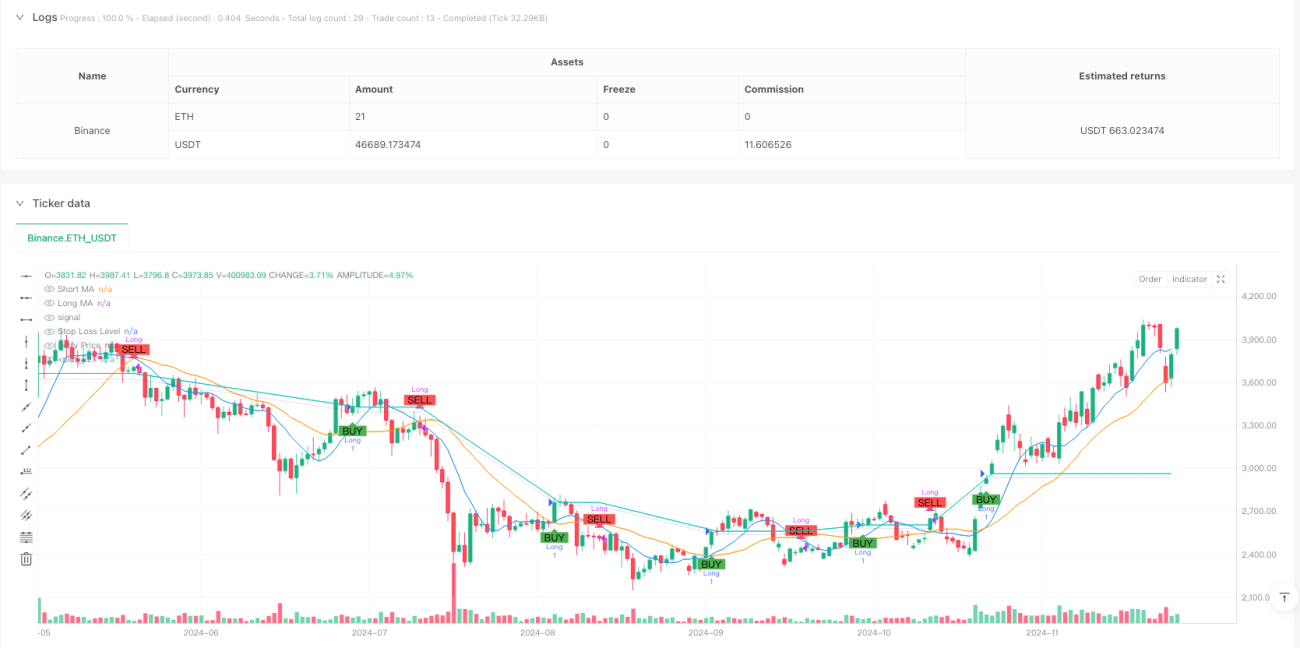
Chiến lược này là một hệ thống giao dịch theo dõi xu hướng dựa trên chéo hai đường trung bình, kết hợp với cơ chế quản lý rủi ro. Chiến lược sử dụng trung bình di chuyển đơn giản ((SMA) với 9 chu kỳ và 21 chu kỳ để nắm bắt xu hướng thị trường, đồng thời thiết lập mức dừng và dừng 1% để kiểm soát rủi ro.
Nguyên tắc chiến lược
Lập luận cốt lõi của chiến lược dựa trên các đặc điểm liên tục của xu hướng thị trường. Đánh giá điểm chuyển hướng bằng cách quan sát sự giao thoa của đường trung bình di chuyển ngắn hạn (thời kỳ 9) và dài hạn (thời kỳ 21). Khi đường trung bình ngắn hạn tạo thành "vòng vàng" khi đi qua đường trung bình dài hạn, cho thấy xu hướng tăng bắt đầu, hệ thống phát ra nhiều tín hiệu; khi đường trung bình ngắn hạn tạo thành "vòng chết" khi đi qua đường trung bình dài hạn, cho thấy xu hướng tăng có thể kết thúc, hệ thống thoát khỏi vị trí bằng phẳng.
Lợi thế chiến lược
- Khả năng nắm bắt xu hướng mạnh mẽ: có thể nắm bắt được xu hướng chính của thị trường tốt hơn bằng cách nắm bắt các điểm chuyển đổi xu hướng bằng cách chéo hai đường bằng nhau.
- Kiểm soát rủi ro hoàn hảo: Thiết lập Stop Loss và Stop Stop với tỷ lệ cố định, kiểm soát hiệu quả rủi ro của giao dịch đơn lẻ.
- Mức độ tự động cao: Hệ thống hoạt động hoàn toàn tự động, không cần sự can thiệp của con người.
- Hiển thị hiệu quả: hiển thị rõ ràng các tín hiệu giao dịch và vùng kiểm soát rủi ro thông qua giao diện đồ họa.
- Tính linh hoạt trong tối ưu hóa tham số: chu kỳ đường trung bình và tỷ lệ dừng lỗ có thể được điều chỉnh theo các đặc điểm thị trường khác nhau.
Rủi ro chiến lược
- Rủi ro của thị trường chấn động: Trong thị trường chấn động theo chiều ngang, sự giao nhau thường xuyên của đường trung bình có thể dẫn đến tín hiệu sai.
- Rủi ro trượt giá: Khi thị trường biến động mạnh, giá giao dịch thực tế có thể bị lệch so với giá tín hiệu.
- Rủi ro đảo ngược xu hướng: Khi xu hướng mạnh đột ngột đảo ngược, dừng cố định có thể không đủ để đối phó với sự biến động lớn.
- Tùy thuộc tham số: hiệu suất chiến lược nhạy cảm với chu kỳ trung bình và cài đặt tham số dừng lỗ.
Hướng tối ưu hóa chiến lược
- Thêm bộ lọc xu hướng: Bạn có thể thêm các chỉ số cường độ xu hướng như ADX để mở lệnh khi xu hướng rõ ràng.
- Cơ chế dừng động: có thể sử dụng ATR hoặc tỷ lệ biến động để điều chỉnh động độ dừng.
- Tăng xác nhận khối lượng giao dịch: sử dụng khối lượng giao dịch như một chỉ số xác nhận phụ trợ cho tín hiệu giao dịch.
- Các tham số tối ưu hóa tự thích ứng: Chu kỳ đường trung bình được điều chỉnh theo động lực của các đặc điểm biến động của thị trường.
- Thêm bộ lọc cường độ xu hướng: có thể kết hợp các chỉ số như RSI để xác định cường độ xu hướng.
Tóm tắt
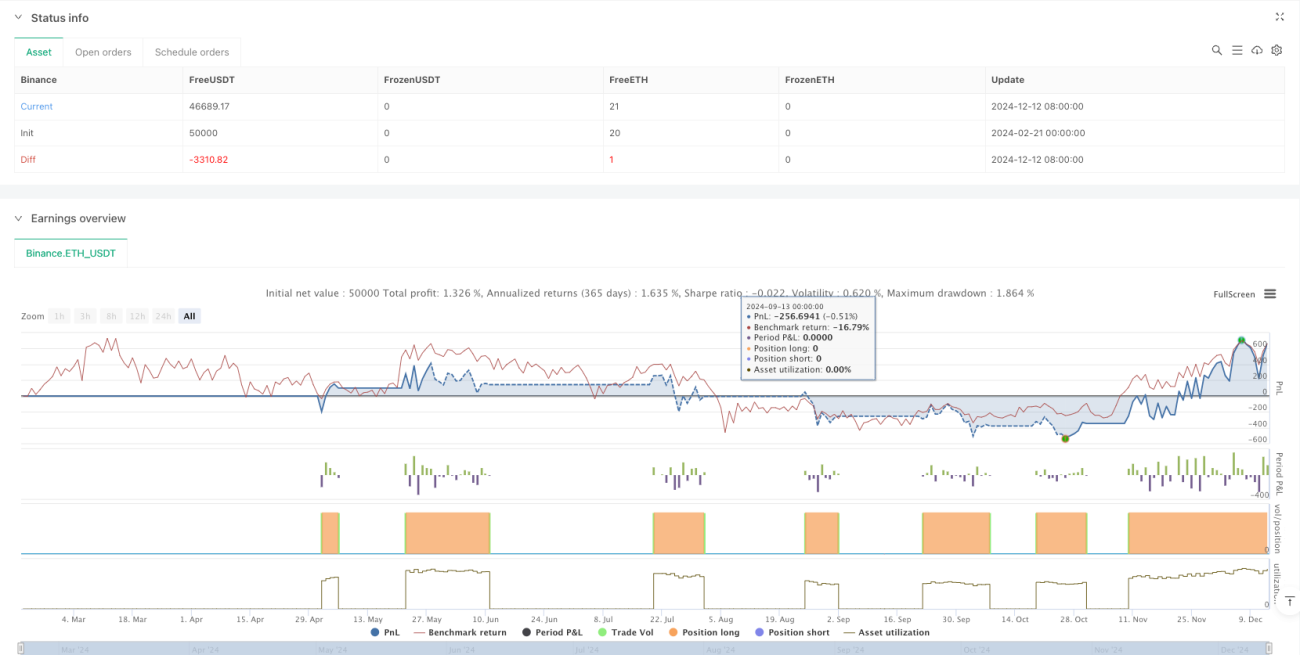
Chiến lược này là một hệ thống giao dịch theo dõi xu hướng hoàn chỉnh hơn bằng cách nắm bắt xu hướng ngang qua hai đường thẳng và kết hợp với cơ chế dừng lỗ để kiểm soát rủi ro. Mặc dù có thể tạo ra tín hiệu giả trong thị trường biến động, nhưng bằng cách tối ưu hóa các tham số hợp lý và tăng các chỉ số phụ trợ, bạn có thể nâng cao hơn nữa sự ổn định và khả năng lợi nhuận của chiến lược. Ưu điểm cốt lõi của chiến lược là mức độ tự động cao, kiểm soát rủi ro hoàn hảo, phù hợp với khung chiến lược cơ bản để theo dõi xu hướng dài hạn.
- 1