Chiến lược giao dịch đột phá động lượng biến động kết hợp bộ lọc xu hướng và động lượng

ATR EMA RSI HH LL RR
Ngày tạo: 2025-02-20 15:13:31 sửa đổi lần cuối: 2025-02-20 15:13:31
sao chép: 1 Số nhấp chuột: 401
2
tập trung vào
319
Người theo dõi

Chiến lược giao dịch đột phá động lượng biến động kết hợp bộ lọc xu hướng và động lượng Chiến lược giao dịch đột phá động lượng biến động kết hợp bộ lọc xu hướng và động lượng

Tổng quan

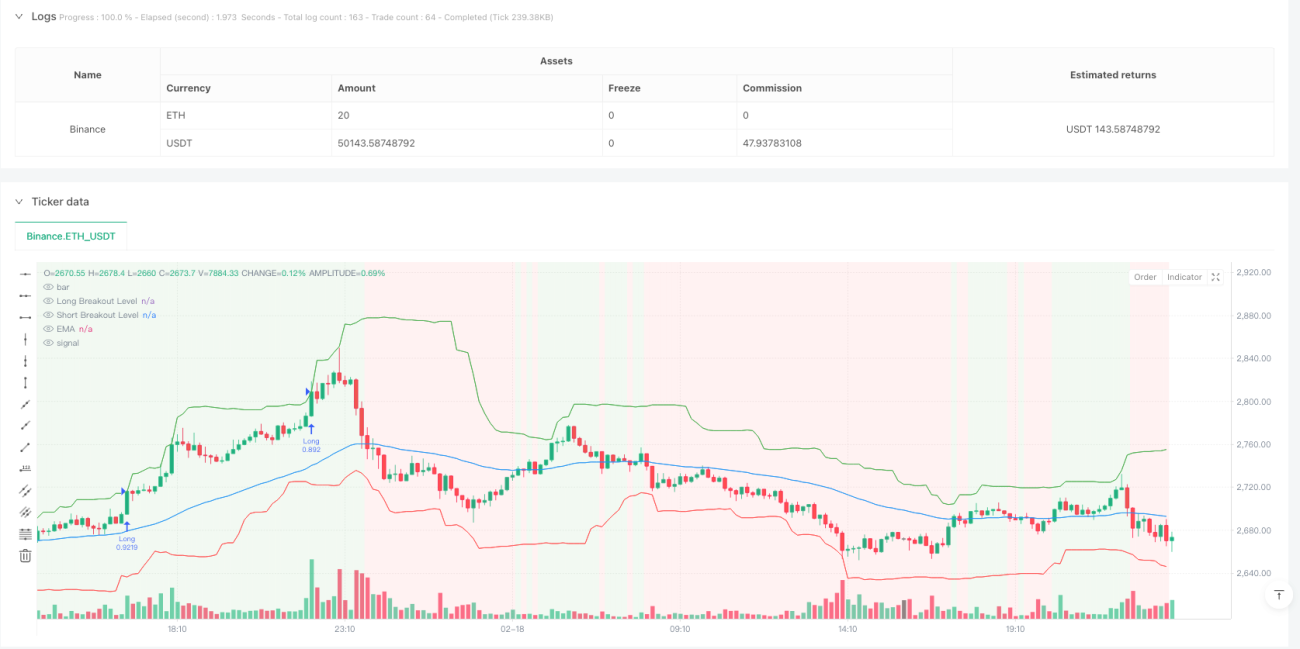
Chiến lược này là một hệ thống giao dịch định lượng kết hợp phá vỡ biến động, theo dõi xu hướng và xác nhận động lực. Nó xác định cơ hội giao dịch bằng cách tính toán mức phá vỡ động dựa trên ATR và kết hợp với bộ lọc xu hướng EMA và chỉ số động lực RSI.

Nguyên tắc chiến lược

Chiến lược bao gồm ba thành phần cốt lõi:

  1. Tính toán đột phá tỷ lệ biến động: Sử dụng giá cao nhất và giá thấp nhất trong thời gian hồi phục, kết hợp với ATR nhân tính toán giá trị đột phá động, tránh sai lệch dự báo.
  2. Trình lọc xu hướng: Sử dụng EMA ngắn hạn để đánh giá xu hướng hiện tại, chỉ đặt hàng nhiều khi giá nằm trên EMA và đặt hàng trống dưới EMA.
  3. Xác nhận động lực: Sử dụng chỉ số RSI để xác nhận động lực thị trường, đầu vào nhiều yêu cầu RSI lớn hơn 50, đầu vào trống yêu cầu RSI nhỏ hơn 50 .

Lợi thế chiến lược

  1. Tính thích ứng động: Mức đột phá sẽ tự động điều chỉnh theo biến động của thị trường, cho phép chiến lược thích ứng với các môi trường thị trường khác nhau.
  2. Bộ lọc đa dạng: kết hợp xu hướng và chỉ số động lực để giảm tín hiệu giả.
  3. Kiểm soát rủi ro nghiêm ngặt: quản lý vị trí bằng tỷ lệ rủi ro cố định và sử dụng bảo vệ dừng lỗ động.
  4. Khả năng tùy chỉnh mạnh mẽ: Các tham số quan trọng như chu kỳ ATR, nhân đếm đột phá, chu kỳ EMA, v.v. có thể được điều chỉnh theo nhu cầu cụ thể.

Rủi ro chiến lược

  1. Rủi ro bị tụt hậu: Sử dụng các chỉ số như trung bình di chuyển có thể gây ra sự tụt hậu điểm vào.
  2. Rủi ro của thị trường chấn động: có thể tạo ra các tín hiệu phá vỡ sai lệch thường xuyên trong thị trường chấn động ngang.
  3. Nhận thức tham số: Hiệu suất của chiến lược nhạy cảm với các thiết lập tham số, cần được kiểm tra đầy đủ. Giải pháp:
  • Đề xuất tối ưu hóa phản hồi trong các môi trường thị trường khác nhau
  • Có thể thêm mô-đun nhận diện môi trường thị trường
  • Hướng dẫn quản lý tài chính bảo thủ hơn

Hướng tối ưu hóa chiến lược

  1. Thích ứng với môi trường thị trường: Thêm phán đoán khoảng dao động, sử dụng các thiết lập tham số khác nhau trong môi trường dao động khác nhau.
  2. Tối ưu hóa tín hiệu: Có thể xem xét thêm xác nhận số lượng giao dịch, tăng độ tin cậy của tín hiệu đột phá.
  3. Tối ưu hóa dừng lỗ: Tỷ lệ lợi nhuận và lỗ hổng có thể được điều chỉnh động, điều chỉnh theo mục tiêu biến động của thị trường.
  4. Bộ lọc thời gian: Tăng bộ lọc cửa sổ thời gian giao dịch để tránh giao dịch trong thời gian bất lợi.

Tóm tắt

Đây là một chiến lược giao dịch định lượng có cấu trúc, logic rõ ràng. Bằng cách kết hợp phá vỡ biến động, theo dõi xu hướng và xác nhận động lực, nó nắm bắt được sự biến động giá đáng kể trong khi kiểm soát rủi ro. Chiến lược có khả năng tùy biến mạnh mẽ, thích hợp để tối ưu hóa thêm để phù hợp với các loại giao dịch và môi trường thị trường khác nhau.

Mã nguồn chiến lược
/*backtest
start: 2025-01-20 00:00:00
end: 2025-02-19 00:00:00
period: 10m
basePeriod: 10m
exchanges: [{"eid":"Binance","currency":"ETH_USDT"}]
*/

//@version=5
// Volatility Momentum Breakout Strategy
//
// Description:
// This strategy is designed to capture significant price moves by combining a volatility breakout method
// with a momentum filter. Volatility is measured by the Average True Range (ATR), which is used to set dynamic
// breakout levels. A short‑term Exponential Moving Average (EMA) is applied as a trend filter, and the Relative
// Strength Index (RSI) is used to help avoid entries when the market is overextended.
// 
// Signal Logic:
// • Long Entry: When the current close is above the highest high of the previous N bars (excluding the current bar)
//   plus a multiple of ATR, provided that the price is above the short‑term EMA and the RSI is above 50.
// • Short Entry: When the current close is below the lowest low of the previous N bars (excluding the current bar)
//   minus a multiple of ATR, provided that the price is below the short‑term EMA and the RSI is below 50.
// 
// Risk Management:
// • Trades are sized to risk 2% of account equity.
// • A stop loss is placed at a fixed ATR multiple away from the entry price.
// • A take profit target is set to achieve a 1:2 risk‑reward ratio.
// 
// Backtesting Parameters:
// • Initial Capital: $10,000
// • Commission: 0.1% per trade
// • Slippage: 1 tick per bar
//
// Disclaimer:
// Past performance is not indicative of future results. This strategy is experimental and provided solely for educational
// purposes. Always backtest and paper trade before any live deployment.
//
// Author: [Your Name]
// Date: [Date]

strategy("Volatility Momentum Breakout Strategy", overlay=true, initial_capital=10000, default_qty_type=strategy.percent_of_equity, default_qty_value=5, commission_type=strategy.commission.percent, commission_value=0.1, slippage=1)

// ─── INPUTS ─────────────────────────────────────────────────────────────
atrPeriod       = input.int(14, "ATR Period", minval=1)
atrMultiplier   = input.float(1.5, "ATR Multiplier for Breakout", step=0.1)
lookback        = input.int(20, "Breakout Lookback Period", minval=1)
emaPeriod       = input.int(50, "EMA Period", minval=1)
rsiPeriod       = input.int(14, "RSI Period", minval=1)
rsiLongThresh   = input.float(50, "RSI Long Threshold", step=0.1)
rsiShortThresh  = input.float(50, "RSI Short Threshold", step=0.1)

// Risk management inputs:
riskPercent     = input.float(2.0, "Risk Percent per Trade (%)", step=0.1) * 0.01   // 2% risk per trade
riskReward      = input.float(2.0, "Risk-Reward Ratio", step=0.1)                    // Target profit is 2x risk
atrStopMult     = input.float(1.0, "ATR Multiplier for Stop Loss", step=0.1)         // Stop loss distance in ATRs

// ─── INDICATOR CALCULATIONS ───────────────────────────────────────────────
atrVal   = ta.atr(atrPeriod)
emaVal   = ta.ema(close, emaPeriod)
rsiVal   = ta.rsi(close, rsiPeriod)

// Calculate breakout levels using the highest high and lowest low of the previous N bars,
// excluding the current bar (to avoid look-ahead bias).
highestHigh = ta.highest(high[1], lookback)
lowestLow   = ta.lowest(low[1], lookback)

// Define breakout thresholds.
longBreakoutLevel  = highestHigh + atrMultiplier * atrVal
shortBreakoutLevel = lowestLow  - atrMultiplier * atrVal

// ─── SIGNAL LOGIC ─────────────────────────────────────────────────────────
// Long Entry: Price closes above the long breakout level,
// the close is above the EMA, and RSI > 50.
longCondition = (close > longBreakoutLevel) and (close > emaVal) and (rsiVal > rsiLongThresh)
// Short Entry: Price closes below the short breakout level,
// the close is below the EMA, and RSI < 50.
shortCondition = (close < shortBreakoutLevel) and (close < emaVal) and (rsiVal < rsiShortThresh)

if (longCondition)
    strategy.entry("Long", strategy.long)
if (shortCondition)
    strategy.entry("Short", strategy.short)

// ─── RISK MANAGEMENT ──────────────────────────────────────────────────────
// For each new trade, use the entry price as the basis for stop loss and target calculations.
// We assume the entry price equals the close on the bar where the trade is triggered.
var float longEntryPrice  = na
var float shortEntryPrice = na

// Record entry prices when a trade is opened.
if (strategy.position_size > 0 and na(longEntryPrice))
    longEntryPrice := strategy.position_avg_price
if (strategy.position_size < 0 and na(shortEntryPrice))
    shortEntryPrice := strategy.position_avg_price

// Calculate stop loss and take profit levels based on ATR.
longStop   = longEntryPrice - atrStopMult * atrVal
longTarget = longEntryPrice + (longEntryPrice - longStop) * riskReward
shortStop  = shortEntryPrice + atrStopMult * atrVal
shortTarget= shortEntryPrice - (shortStop - shortEntryPrice) * riskReward

// Issue exit orders if a position is open.
if (strategy.position_size > 0 and not na(longEntryPrice))
    strategy.exit("Long Exit", from_entry="Long", stop=longStop, limit=longTarget)
if (strategy.position_size < 0 and not na(shortEntryPrice))
    strategy.exit("Short Exit", from_entry="Short", stop=shortStop, limit=shortTarget)

// Reset recorded entry prices when the position is closed.
if (strategy.position_size == 0)
    longEntryPrice  := na
    shortEntryPrice := na

// ─── CHART VISUAL AIDS ─────────────────────────────────────────────────────
// Plot the breakout levels and EMA.
plot(longBreakoutLevel, color=color.new(color.green, 0), title="Long Breakout Level", style=plot.style_linebr)
plot(shortBreakoutLevel, color=color.new(color.red, 0), title="Short Breakout Level", style=plot.style_linebr)
plot(emaVal, color=color.blue, title="EMA")

// Optionally, shade the background: green when price is above the EMA (bullish) and red when below.
bgcolor(close > emaVal ? color.new(color.green, 90) : color.new(color.red, 90), title="Trend Background")