Chiến lược kiểm soát rủi ro động mô hình Engulfing nâng cao của Supertrend

Tổng quan
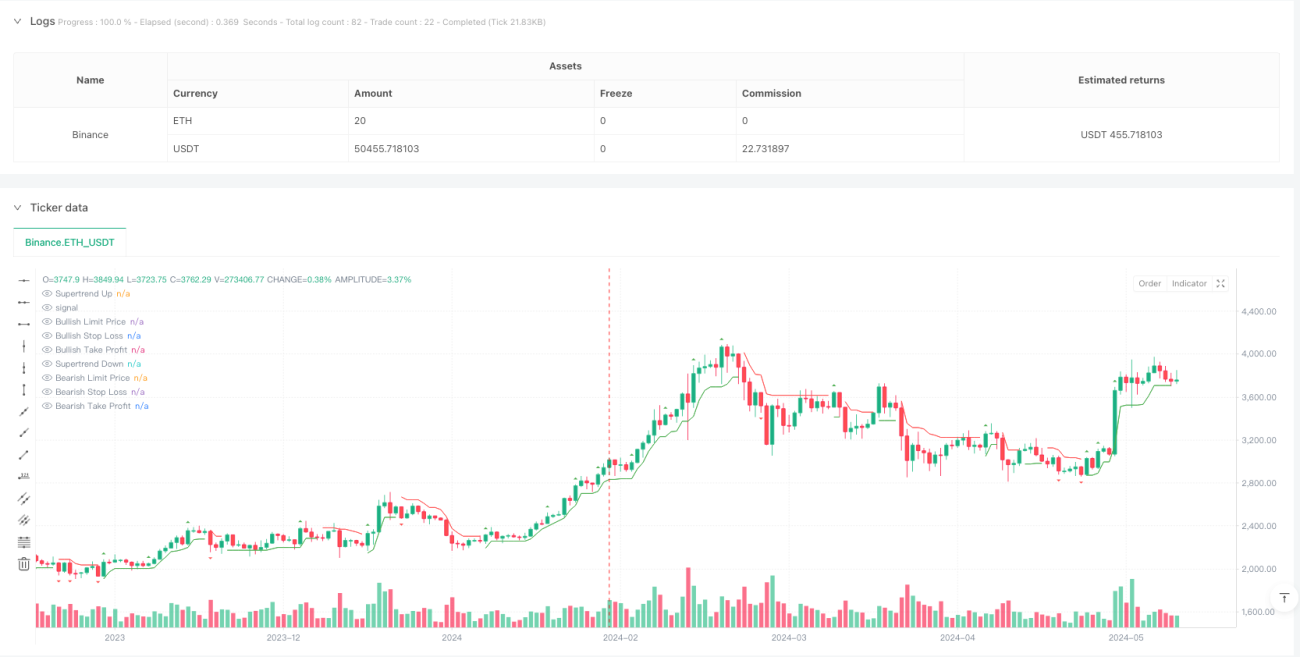
Đây là một chiến lược giao dịch cao cấp kết hợp chỉ số Supertrend và hình thức ăn uống. Chiến lược này xác định định hướng xu hướng của xu hướng bằng cách xác định mô hình vẽ hình thức ăn uống trong thị trường và kết hợp với chỉ số Supertrend để có thể lọc các tín hiệu giao dịch chính xác. Chiến lược này cũng tích hợp các thiết lập dừng lỗ và lợi nhuận động để kiểm soát rủi ro hiệu quả và đảm bảo lợi nhuận.
Nguyên tắc chiến lược
Chiến lược này dựa trên những nguyên tắc cốt lõi sau:
- Sử dụng ATR để tính toán chỉ số Supertrend để xác định xu hướng thị trường tổng thể.
- Chọn các hình thức nuốt có hiệu quả bằng cách đặt Boring Candle Threshold và Engulfing Candle Threshold.
- Chỉ đặt vị trí khi hướng xu hướng Supertrend phù hợp với hướng hình dạng ăn mòn.
- Sử dụng thiết lập điểm dừng và lợi nhuận động, tính theo tỷ lệ dựa trên giá mở vị trí.
- Sử dụng quản lý vị trí chiến lược để đảm bảo chỉ có một hướng giao dịch tại một thời điểm.
Lợi thế chiến lược
- Chất lượng tín hiệu được kiểm soát chặt chẽ, tăng độ chính xác bằng cách xác nhận kép ((trend + form) <unk>
- Tiêu chuẩn này được sử dụng để lọc các tín hiệu giả.
- Tính năng tính toán Supertrend dựa trên ATR giúp chiến lược có khả năng thích ứng tốt với thị trường.
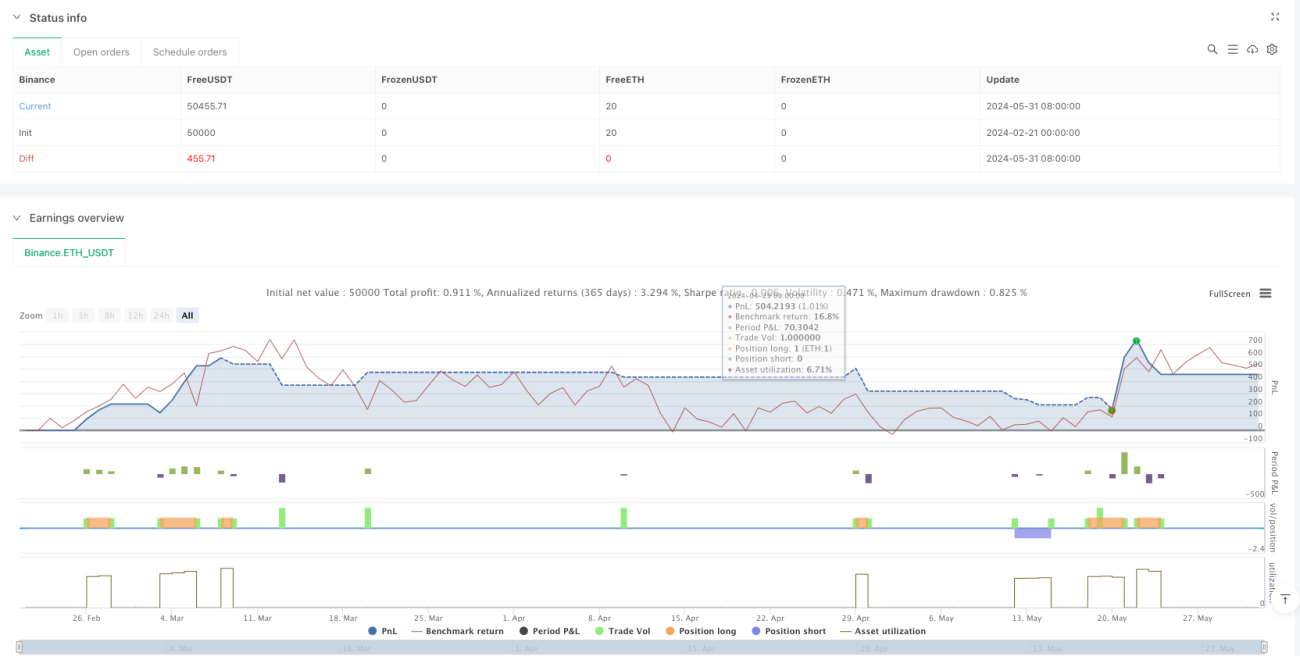
- Cơ chế quản lý lỗ hổng và lợi nhuận tốt, kiểm soát rủi ro và khóa lợi nhuận.
- Hình ảnh được làm rất tốt, tín hiệu giao dịch, điểm dừng lỗ và mục tiêu lợi nhuận đều được hiển thị rõ ràng.
Rủi ro chiến lược
- Các tín hiệu phá vỡ giả có thể xảy ra thường xuyên trong thị trường bất ổn.
- Các thiết lập dừng lỗ và lợi nhuận cố định có thể không phù hợp với tất cả các môi trường thị trường.
- Có thể sẽ có một sự rút lui lớn hơn nếu xu hướng thay đổi.
- Cài đặt tham số nhạy cảm, tham số không phù hợp có thể dẫn đến hoạt động không tốt của chiến lược.
- Trong một thị trường ít lưu động, có thể có nguy cơ trượt.
Hướng tối ưu hóa chiến lược
- Có thể giới thiệu chỉ số giao thông như tín hiệu xác nhận.
- Cân nhắc tham gia cơ chế điều chỉnh ATR nhân động.
- Tỷ lệ dừng lỗ và lợi nhuận được điều chỉnh theo biến động của thị trường.
- Thêm bộ lọc thời gian để tránh giao dịch trong khoảng thời gian không phù hợp.
- Xem xét thêm bộ lọc cường độ xu hướng để cải thiện chất lượng giao dịch.
Tóm tắt
Đây là một chiến lược được thiết kế nghiêm ngặt, logic rõ ràng, thông qua kết hợp các chỉ số kỹ thuật và phân tích hình dạng, thực hiện kiểm soát chất lượng tín hiệu tốt. Cơ chế quản lý rủi ro của chiến lược được hoàn thiện, hiệu quả trực quan xuất sắc, phù hợp để thử nghiệm và tối ưu hóa thực tế.
- 1