Hệ thống giao dịch quản lý rủi ro động dựa trên đường trung bình động và vùng cung cầu

Tổng quan
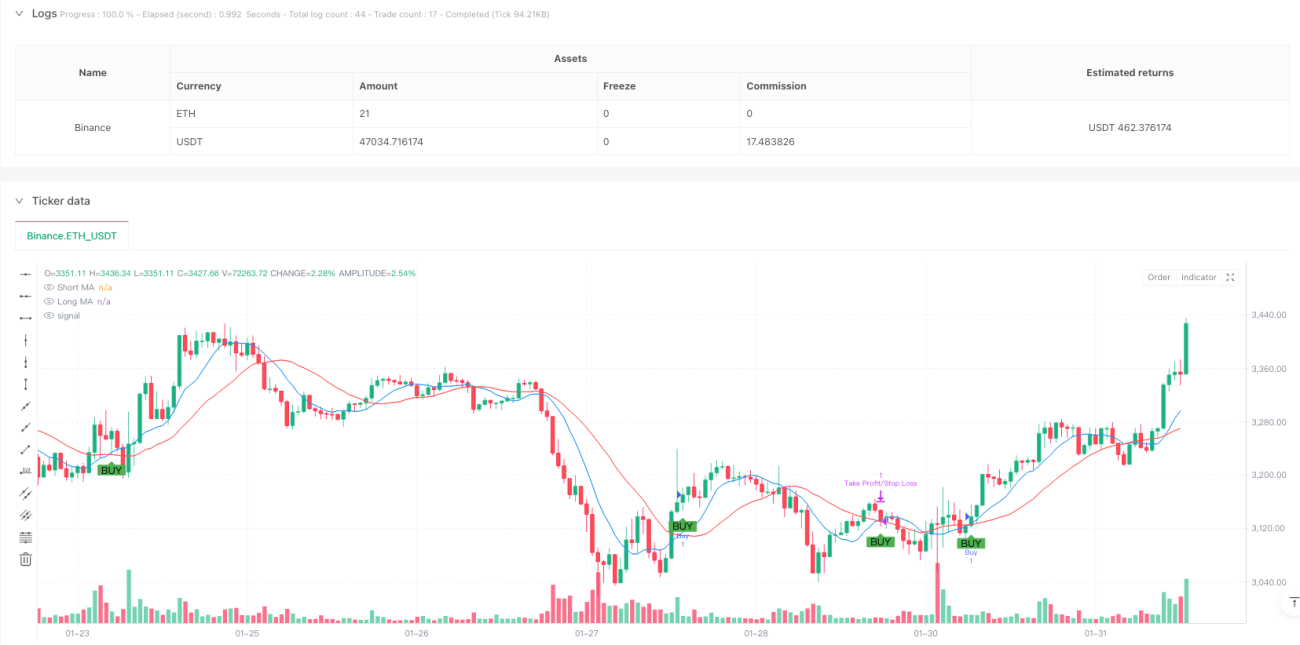
Đây là một chiến lược giao dịch tổng hợp kết hợp các đường trung bình di chuyển, nhận diện vùng cung ứng và nhu cầu, và các điểm dừng động. Chiến lược này xác định hướng giao dịch bằng cách giao nhau giữa các đường trung bình di chuyển ngắn hạn và dài hạn, đồng thời sử dụng vùng cung ứng và nhu cầu làm điểm hỗ trợ và kháng cự giá trị quan trọng, và phối hợp với điểm dừng phần trăm để quản lý rủi ro.
Nguyên tắc chiến lược
Chiến lược sử dụng đường trung bình di chuyển đơn giản (SMA) 9 chu kỳ và 21 chu kỳ để xác định hướng xu hướng. Hệ thống phát ra nhiều tín hiệu khi giá nằm trong phạm vi 1% của vùng nhu cầu (SMA) và đường trung bình ngắn hạn đi lên vượt qua đường trung bình dài hạn. Hệ thống phát ra tín hiệu trống khi giá nằm trong phạm vi 1% của vùng cung cấp (SMA) và đường trung bình ngắn hạn đi xuống vượt qua đường trung bình dài hạn.
Lợi thế chiến lược
- Cơ chế xác nhận đa dạng: kết hợp các chỉ số kỹ thuật (đường chéo trung bình) và cấu trúc giá (khu vực cung cầu), giảm nguy cơ đột phá giả
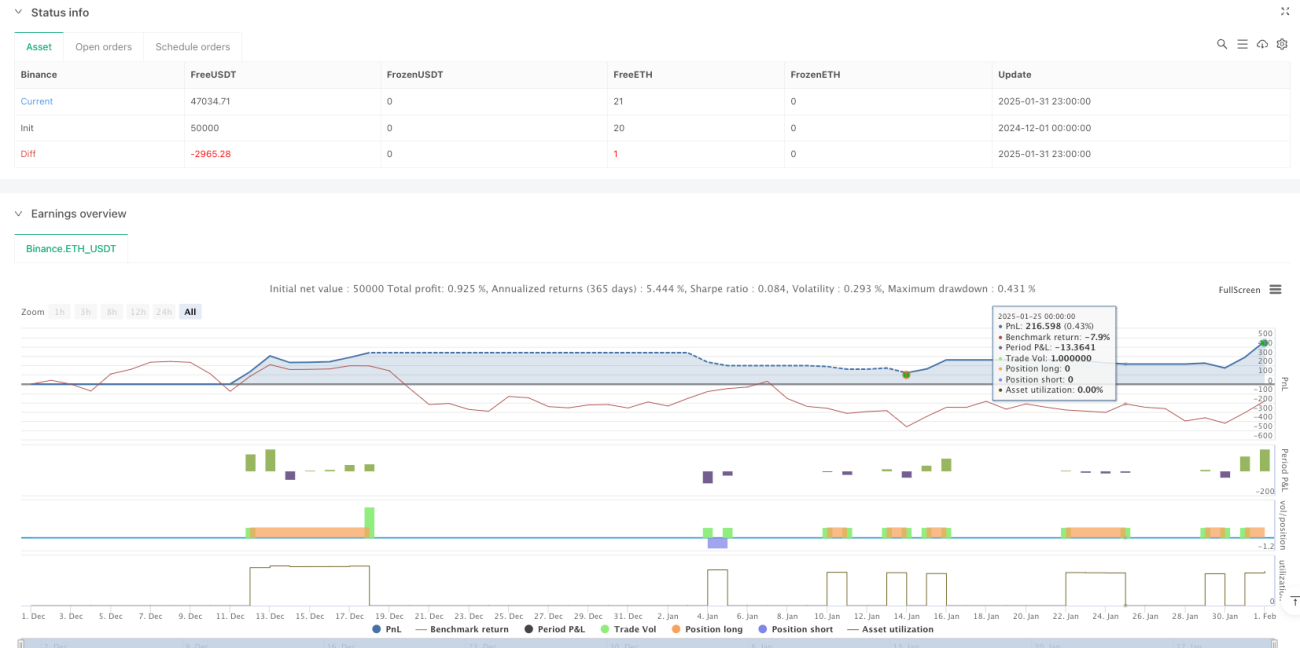
- Quản lý rủi ro động: Cài đặt dừng lỗ dựa trên tỷ lệ phần trăm của giá vào, thích ứng với các môi trường thị trường khác nhau
- Tín hiệu giao dịch trực quan: Đánh dấu rõ ràng vùng cung và tín hiệu giao dịch trên biểu đồ để phân tích và xác minh dễ dàng
- Các tham số có thể được điều chỉnh một cách linh hoạt: chu kỳ đường trung bình, điều kiện xác nhận khu vực cung cấp và nhu cầu, tỷ lệ dừng lỗ có thể được điều chỉnh theo các đặc điểm thị trường khác nhau
- Logic chiến lược rõ ràng: Điều kiện nhập cảnh và xuất cảnh rõ ràng, dễ dàng để phản hồi và tối ưu hóa
Rủi ro chiến lược
- Rủi ro thị trường chấn động: Tần suất giao nhau có thể dẫn đến quá nhiều tín hiệu giả
- Rủi ro trượt: giao dịch gần khu vực cung ứng có thể gặp trượt lớn hơn
- Tính nhạy cảm của tham số: Các tham số tối ưu có thể khác nhau trong các môi trường thị trường khác nhau
- Rủi ro Stop Loss Rate: Stop Loss Rate có thể không phù hợp với tất cả các trường hợp thị trường
- Rủi ro quản lý tiền: Chiến lược không bao gồm chức năng quản lý quy mô vị trí
Hướng tối ưu hóa chiến lược
- Tiếp tục xác nhận số lượng giao dịch: Thêm các chỉ số số giao dịch vào phân tích vùng cung cấp và nhu cầu, tăng độ tin cậy tín hiệu
- Tối ưu hóa tham số động: Tự động điều chỉnh tỷ lệ dừng lỗ và phạm vi khu vực cung ứng theo biến động của thị trường
- Thêm bộ lọc xu hướng: Thêm định hướng có chu kỳ dài hơn, tránh giao dịch ngược lại xu hướng lớn
- Quản lý tài chính tốt hơn: Thêm tính toán quy mô vị trí dựa trên tỷ lệ biến động
- Tăng cường nhận diện khu vực cung ứng và nhu cầu: giới thiệu nhiều chỉ số kỹ thuật hơn để xác nhận hiệu quả của khu vực cung ứng và nhu cầu
Tóm tắt
Đây là một hệ thống chiến lược kết hợp các phương pháp phân tích kỹ thuật cổ điển với các tư tưởng quản lý rủi ro hiện đại. Bằng cách giao dịch gần khu vực giá quan trọng và kết hợp với tín hiệu giao dịch chéo đường trung bình di động, chiến lược cung cấp một khung giao dịch tương đối đáng tin cậy. Thiết kế dừng lỗ động giúp thích ứng với các môi trường thị trường khác nhau, nhưng ứng dụng thực tế của chiến lược cũng cần được tối ưu hóa theo đặc điểm thị trường cụ thể.
- 1