Chiến lược giao dịch đột phá hỗ trợ và kháng cự động kết hợp với hệ thống lọc xu hướng và quản lý rủi ro

Tổng quan
Đây là một chiến lược giao dịch dựa trên phá vỡ vùng kháng cự hỗ trợ, kết hợp với bộ lọc xu hướng và hệ thống quản lý rủi ro. Chiến lược xác định các cơ hội giao dịch tiềm năng bằng cách xác định động mức giá quan trọng và sử dụng đường trung bình di chuyển để xác nhận hướng xu hướng của thị trường. Chiến lược này sử dụng phương pháp quản lý tiền bảo thủ, hạn chế rủi ro trên mỗi giao dịch trong vòng 1% số tiền tài khoản, đồng thời sử dụng tỷ lệ rủi ro lợi nhuận 2: 1 để thiết lập vị trí dừng.
Nguyên tắc chiến lược
Lập luận cốt lõi của chiến lược bao gồm các thành phần quan trọng sau:
- Sử dụng điểm cao và điểm thấp của trục để xác định vùng kháng cự hỗ trợ tiềm năng
- Tạo vùng hỗ trợ kháng cự bằng cách đặt phần trăm giá lệch
- Sử dụng đường trung bình di chuyển 200 ngày làm bộ lọc xu hướng
- Xác định tính hiệu quả của đột phá bằng hình dạng phác họa
- Thực hiện các quy tắc quản lý tiền nghiêm ngặt, kiểm soát rủi ro cho mỗi giao dịch
Khi giá phá vỡ vùng kháng cự và xu hướng tăng, hệ thống sẽ mở vị trí đầu nhiều; Khi giá phá vỡ vùng hỗ trợ và xu hướng giảm, hệ thống sẽ mở vị trí đầu trống.
Lợi thế chiến lược
- Khả năng nhận diện cấu trúc thị trường động - Chiến lược có thể tự động nhận diện và cập nhật các mức giá quan trọng để thích ứng với sự thay đổi của thị trường
- Cơ chế xác nhận đa dạng - kết hợp với lọc xu hướng và xác nhận phím lọc, giảm nguy cơ đột phá giả
- Quản lý rủi ro tốt - Sử dụng luật rủi ro cố định để bảo vệ tiền trong tài khoản
- Mục tiêu lợi nhuận rõ ràng - Sử dụng rủi ro lợi nhuận 2: 1 so với thiết lập vị trí dừng
- Tín hiệu giao dịch trực quan - hiển thị rõ ràng các vùng kháng cự hỗ trợ và đường dừng lỗ trên biểu đồ
Rủi ro chiến lược
- Rủi ro biến động thị trường - có thể có điểm trượt trong thời gian biến động cao, ảnh hưởng đến hiệu quả giao dịch thực tế
- Rủi ro đảo ngược xu hướng - Thị trường có thể đảo ngược nhanh chóng sau khi phá vỡ, dẫn đến dừng lỗ
- Rủi ro tối ưu hóa tham số - tham số tối ưu hóa quá mức có thể dẫn đến quá phù hợp
- Rủi ro quản lý tiền - Hạn chế liên tục có thể ảnh hưởng đến tăng trưởng tài khoản
Những rủi ro này nên được quản lý bằng cách phản hồi các điều kiện thị trường khác nhau và điều chỉnh các thiết lập tham số.
Hướng tối ưu hóa chiến lược
- Động thái điều chỉnh chiều rộng vùng hỗ trợ - tự động điều chỉnh phạm vi vùng theo biến động của thị trường
- Tăng xác nhận số lượng giao dịch - thêm điều kiện lọc số lượng giao dịch trong tín hiệu đột phá
- Tối ưu hóa bộ lọc xu hướng - Xem xét sử dụng xác nhận xu hướng đa chu kỳ
- Cải thiện chiến lược dừng chân - thực hiện dừng chân động, điều chỉnh mục tiêu lợi nhuận theo tình hình thị trường
- Thêm bộ lọc thời gian - tránh giao dịch trong các khoảng thời gian có biến động lớn của thị trường
Tóm tắt
Đây là một chiến lược giao dịch có cấu trúc tốt, cung cấp một phương pháp giao dịch có hệ thống bằng cách kết hợp các nguyên tắc phân tích kỹ thuật và quản lý rủi ro. Ưu điểm của chiến lược là có quy tắc giao dịch toàn diện và kiểm soát rủi ro nghiêm ngặt, nhưng cũng đòi hỏi các nhà giao dịch phải hiểu được các hạn chế của nó và tối ưu hóa và điều chỉnh thích hợp theo tình hình giao dịch thực tế.
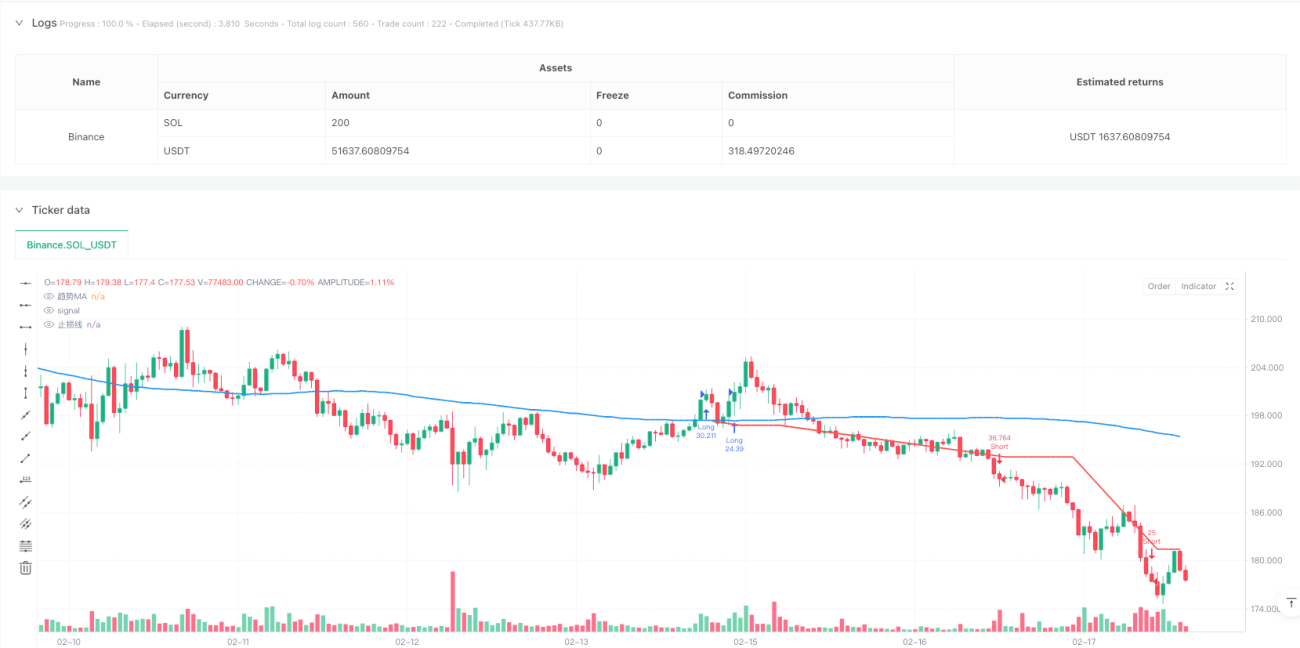
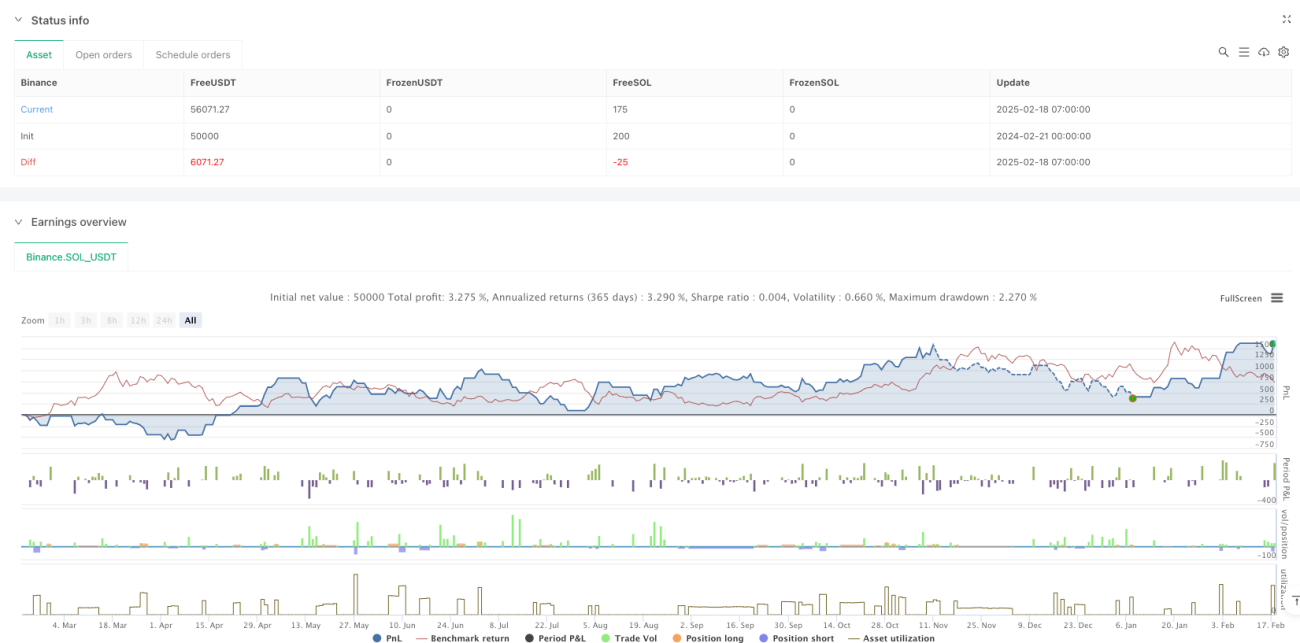
/*backtest
start: 2024-02-21 00:00:00
end: 2025-02-18 08:00:00
period: 1h
basePeriod: 1h
exchanges: [{"eid":"Binance","currency":"SOL_USDT"}]
*/

//@version=5
strategy("支撑/阻力区域突破策略(2倍止盈 + 蜡烛确认 + 趋势过滤)", overlay=true, initial_capital=10000, currency=currency.USD, pyramiding=0, calc_on_order_fills=true, calc_on_every_tick=true)

// 用户输入设置- 1