Chiến lược thích ứng cao thấp giao thoa EMA động

Tổng quan
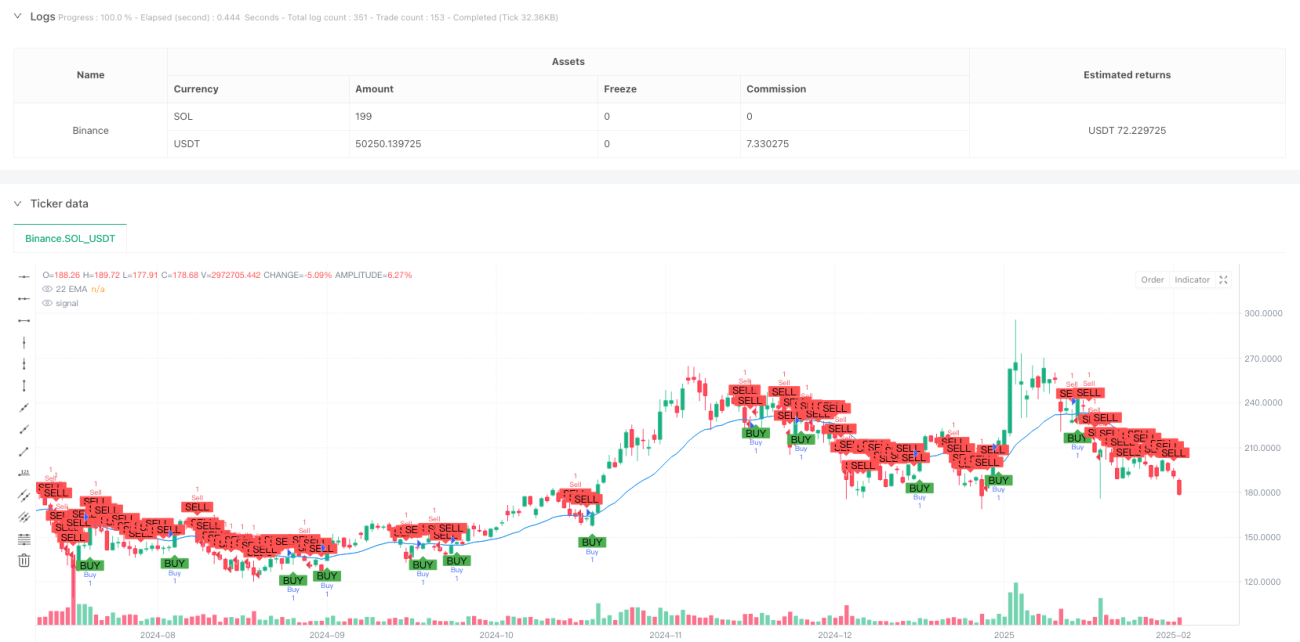
Chiến lược này là một hệ thống giao dịch dựa trên các tín hiệu giao thoa và điểm dao động của chỉ số 22 chu kỳ moving average (EMA). Nó tạo ra tín hiệu giao dịch bằng cách giao thoa giá với EMA và sử dụng các điểm cao và thấp tự động để thiết lập vị trí dừng lỗ. Phương pháp này đảm bảo chức năng cơ bản của theo dõi xu hướng và tăng tính linh hoạt trong quản lý rủi ro.
Nguyên tắc chiến lược
Logic cốt lõi của chiến lược bao gồm các yếu tố chính sau:
- Sử dụng 22 chu kỳ EMA như một chỉ số xu hướng chính, chu kỳ này có thể lọc tốt hơn tiếng ồn thị trường
- Khi giá đóng cửa vượt qua EMA, kích hoạt tín hiệu nhiều, khi đi xuống kích hoạt tín hiệu trống
- Tính toán điểm cao và điểm thấp qua dữ liệu lịch sử 14 chu kỳ
- Giao dịch nhiều hơn với mục tiêu dừng chân ở mức cao nhất gần đây, dừng lỗ ở mức thấp nhất
- Giao dịch tháo lỗ với mục tiêu dừng chân ở mức thấp nhất gần đây và điểm dừng chân ở mức cao nhất
Lợi thế chiến lược
- Khả năng thích ứng với xu hướng: EMA 22 chu kỳ có thể nắm bắt hiệu quả xu hướng trung hạn, tránh giao dịch quá thường xuyên
- Quản lý rủi ro động: Địa điểm dừng lỗ sẽ tự động điều chỉnh theo biến động của thị trường, tăng khả năng thích ứng của chiến lược
- Thực hiện rõ ràng: tín hiệu giao dịch rõ ràng, không có vùng mờ để phán đoán
- Tỷ lệ lợi nhuận rủi ro hợp lý: đảm bảo tỷ lệ lợi nhuận rủi ro của mỗi giao dịch tương đối ổn định bằng cách di chuyển thiết lập điểm dừng
- Hiệu quả hình ảnh tốt: Chiến lược cung cấp tín hiệu hình ảnh rõ ràng giúp thương nhân hiểu và theo dõi
Rủi ro chiến lược
- Rủi ro của thị trường chấn động: có thể xảy ra các tín hiệu phá vỡ sai thường xuyên trong thị trường chấn động ngang
- Rủi ro trượt: Trong thời gian biến động mạnh, giá giao dịch thực tế có thể có sai lệch lớn so với giá tín hiệu
- Rủi ro nhảy vọt: Thị trường nhảy vọt có thể dẫn đến hiệu quả dừng lỗ, gây ra tổn thất vượt mức dự kiến
- Rủi ro biến đổi xu hướng: Có thể có tổn thất liên tục gần điểm biến đổi xu hướng chính
Hướng tối ưu hóa chiến lược
- Tiến hành chỉ số giao dịch: có thể xác nhận độ tin cậy của tín hiệu thông qua giao dịch
- Thêm bộ lọc xu hướng: Trung bình di chuyển kết hợp với chu kỳ dài hơn để lọc các tín hiệu ngược xu hướng
- Phương pháp tối ưu hóa dừng: Có thể xem xét sử dụng ATR để điều chỉnh động khoảng cách dừng
- Thêm bộ lọc thời gian: cấm mở vị trí trong một khoảng thời gian nhất định để tránh thời gian biến động lớn
- Phát triển cơ chế xác nhận tín hiệu: kết hợp với các chỉ số kỹ thuật khác để xác nhận tín hiệu, tăng tỷ lệ thắng
Tóm tắt
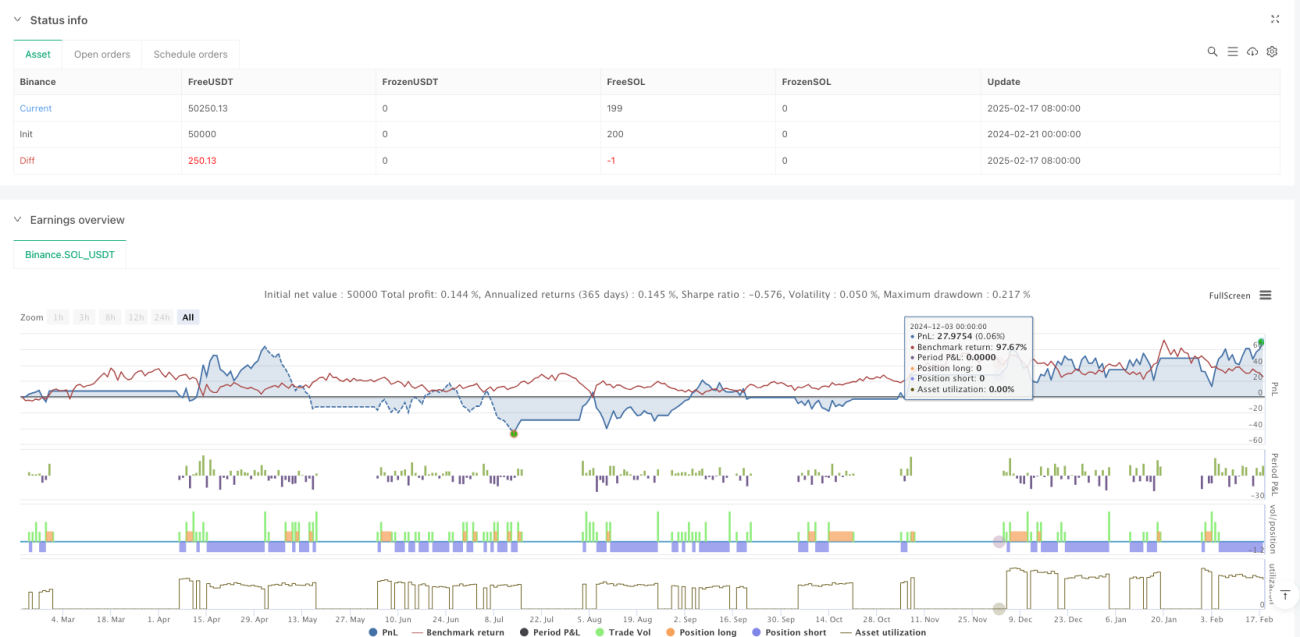
Đây là một chiến lược theo dõi xu hướng có cấu trúc và logic rõ ràng. Nó tạo ra tín hiệu giao dịch thông qua giao dịch EMA, sử dụng rủi ro quản lý điểm dao động để tạo ra một hệ thống giao dịch cân bằng. Ưu điểm chính của chiến lược là khả năng thích ứng với thị trường động, trong khi rủi ro chính xuất phát từ sự thay đổi của tình trạng thị trường.
- 1