
Let me analyze this trading strategy code and create a comprehensive article in both Chinese and English as requested.
Tổng quan
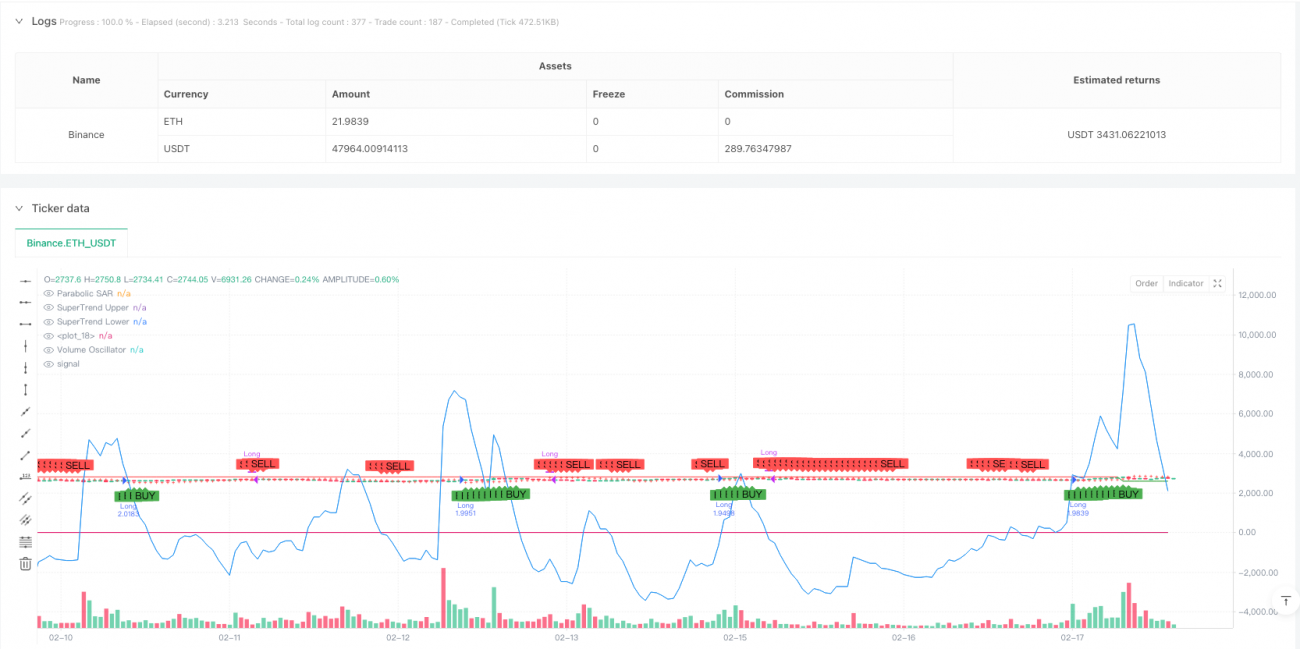
Chiến lược này là một hệ thống giao dịch tổng hợp kết hợp các chỉ số SAR, chỉ số SuperTrend và dao động khối lượng giao dịch. Chiến lược này chủ yếu sử dụng các chỉ số kỹ thuật đa chiều để xác nhận xu hướng thị trường, tăng độ tin cậy của tín hiệu giao dịch thông qua xác minh lẫn nhau giữa các chỉ số. Ý tưởng cốt lõi của thiết kế chiến lược là xác nhận tín hiệu trên ba chiều xu hướng, động lực và khối lượng giao dịch, giao dịch chỉ khi tín hiệu đồng nhất trong ba chiều.
Nguyên tắc chiến lược
Chiến lược này sử dụng ba chỉ số cốt lõi:
- Đường PARALY SAR ((đầu 0.02, nhân tố gia tốc 0.02, tối đa 0.2): được sử dụng để xác định điểm đảo chiều của xu hướng giá, khi giá nằm trên điểm SAR thì tăng, ngược lại là giảm.
- SuperTrend ((chu kỳ 10, nhân số 3): kết hợp với chỉ số biến động ATR, tạo ra một kênh xu hướng động. Khi giá phá vỡ đường lên, nó tạo ra tín hiệu đa và khi phá vỡ đường xuống, nó tạo ra tín hiệu hẹp.
- Trọng lượng giao dịch biến động ((tạm thời 14, dài hạn 28): đo mức độ hoạt động giao dịch bằng cách so sánh trung bình chuyển động ngắn hạn và dài hạn của khối lượng giao dịch, tích cực cho thấy khối lượng giao dịch tăng và âm tính cho thấy khối lượng giao dịch giảm.
Logic tạo tín hiệu giao dịch:
- Làm nhiều điều kiện: Giá trên SAR + SuperTrend bullish ((giá trên đường mòn dưới) + Vô số giao dịch là tích cực
- Điều kiện giao dịch bằng phẳng: Giá dưới SAR + Suy giảm SuperTrend (giá dưới đường đi lên) + Động cơ giao dịch âm
Lợi thế chiến lược
- Xác nhận đa chiều: Xác nhận tín hiệu giao dịch bằng cách cộng hưởng ba chiều về xu hướng giá, kênh động và khối lượng giao dịch, làm giảm đáng kể nguy cơ phá vỡ giả.
- Phong cách thích ứng động: Chỉ số SuperTrend dựa trên ATR động điều chỉnh chiều rộng kênh, có thể thích ứng tốt hơn với môi trường biến động thị trường khác nhau.
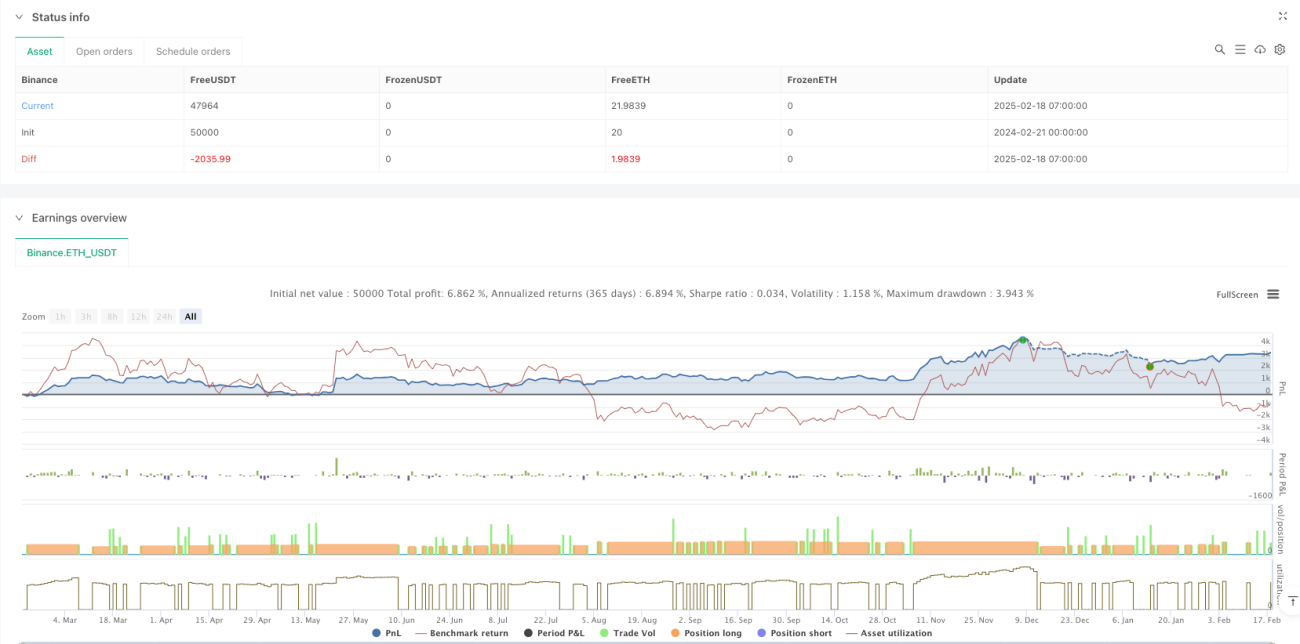
- Kiểm soát rủi ro: Sử dụng quản lý vị trí tỷ lệ phần trăm ((được thiết lập là 10% giá trị tài khoản ròng), kiểm soát hiệu quả các lỗ hổng rủi ro cho mỗi giao dịch.
- Hiệu ứng hình ảnh: Chiến lược cung cấp phản hồi hình ảnh rõ ràng, bao gồm điểm SAR, đám mây xu hướng và dấu hiệu tín hiệu giao dịch.
Rủi ro chiến lược
- Rủi ro thị trường rung động: Trong thị trường rung động ngang có thể xảy ra các tín hiệu sai thường xuyên, dẫn đến tổn thất liên tục.
- Rủi ro bị tụt hậu: Do sử dụng nhiều chỉ số loại trung bình di chuyển, tín hiệu có một số độ trễ, có thể bỏ lỡ điểm nhập cảnh tốt nhất.
- Tính nhạy cảm tham số: hiệu quả chiến lược nhạy cảm với các thiết lập tham số, các môi trường thị trường khác nhau có thể yêu cầu các tổ hợp tham số khác nhau.
- Tác động chi phí: giao dịch thường xuyên có thể dẫn đến chi phí giao dịch cao hơn, ảnh hưởng đến thu nhập tổng thể.
Hướng tối ưu hóa chiến lược
- Bộ lọc môi trường thị trường: đề xuất thêm mô-đun nhận diện môi trường thị trường, tự động giảm vị trí hoặc tạm dừng giao dịch trong thị trường biến động.
- Tối ưu hóa tham số động: có thể tự động điều chỉnh các tham số của SuperTrend theo biến động của thị trường, tăng khả năng thích ứng chiến lược.
- Tối ưu hóa dừng lỗ: khuyến nghị thêm chức năng theo dõi dừng lỗ, khóa lợi nhuận kịp thời khi xu hướng đảo ngược.
- Tối ưu hóa giai đoạn: Bạn có thể điều chỉnh yêu cầu giá trị mốc của tín hiệu kích hoạt cho các đặc điểm của các giai đoạn giao dịch khác nhau.
- Kiểm soát chi phí: Bạn có thể tăng giới hạn thời gian nắm giữ để tránh giao dịch quá thường xuyên.
Tóm tắt
Chiến lược này xây dựng một hệ thống giao dịch tương đối hoàn chỉnh bằng cách kết hợp theo dõi xu hướng và phân tích khối lượng giao dịch. Đặc điểm chính của chiến lược là sử dụng xác nhận nhiều chỉ số để tăng độ tin cậy của giao dịch, đồng thời cung cấp tài liệu tham khảo quyết định trực quan cho thương nhân thông qua thiết kế trực quan. Mặc dù có một số vấn đề về độ chậm trễ và độ nhạy cảm của tham số, chiến lược này có giá trị thực tế tốt thông qua các biện pháp kiểm soát tối ưu hóa và rủi ro hợp lý.
//@version=5
strategy("Parabolic SAR + SuperTrend + Volume Oscillator Strategy", overlay=true, default_qty_type=strategy.percent_of_equity, default_qty_value=10)

// --- Parabolic SAR Parameters ---
sar_start = 0.02
sar_increment = 0.02
sar_max = 0.2
sar = ta.sar(sar_start, sar_increment, sar_max)
plot(sar, color=color.red, style=plot.style_cross, title="Parabolic SAR")

// --- SuperTrend Parameters ---
st_length = 10- 1