
Tổng quan
Chiến lược này là một hệ thống giao dịch định lượng kết hợp nhiều chỉ số kỹ thuật, kết hợp hợp tác với ba chỉ số kỹ thuật cổ điển thông qua moving average (MA), chỉ số tương đối mạnh (RSI) và moving average convergence divergence (MACD) để xây dựng một hệ thống tín hiệu giao dịch hoàn chỉnh. Chiến lược này sử dụng theo dõi xu hướng kết hợp với nhận dạng động lượng, đồng thời đảm bảo hướng giao dịch đúng, đồng thời tập trung vào nắm bắt cơ hội. Đồng thời tích hợp các cơ chế kiểm soát rủi ro như dừng lỗ, dừng và theo dõi lỗ, tạo thành một chiến lược giao dịch có hệ thống.
Nguyên tắc chiến lược
Chiến lược này xây dựng tín hiệu giao dịch dựa trên ba cấp độ:
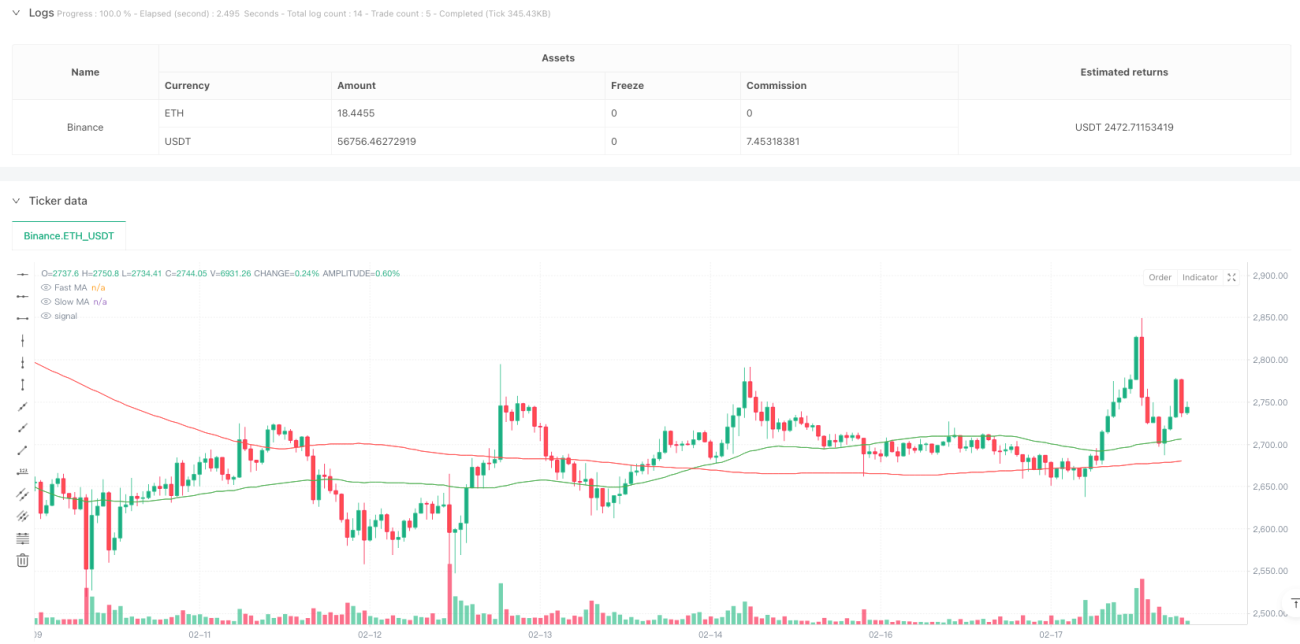
- Xác định xu hướng: Sử dụng hệ thống hai đường trung bình 50 ngày và 200 ngày để xác định hướng xu hướng lớn thông qua gai vàng
- Xác nhận động lực: kết hợp với RSI vượt mức mua bán ((70/30) và MACD Gold Fork Dead Fork, xác nhận động lực giá
- Kiểm soát rủi ro: thiết lập 2% dừng lỗ, 4% dừng và 1% theo dõi dừng lỗ, xây dựng hệ thống quản lý rủi ro hoàn chỉnh
Cụ thể, khi đường trung bình nhanh (trên 50 ngày) xuyên qua đường trung bình chậm (trên 200 ngày) hình thành nếp nhăn vàng, đồng thời RSI không đạt đến mức mua quá mức và MACD hình thành nếp nhăn vàng, hệ thống tạo ra tín hiệu làm nhiều. Ngược lại, khi nếp nhăn chết xuất hiện và RSI không đạt đến mức bán quá mức, MACD hình thành nếp nhăn chết, hệ thống tạo ra tín hiệu làm trống.
Lợi thế chiến lược
- Tín hiệu đáng tin cậy cao: có thể lọc hiệu quả tín hiệu giả thông qua xác minh chéo đa chỉ số
- Tính chính xác trong việc nắm bắt xu hướng: sử dụng hệ thống hai đường thẳng cổ điển để nắm bắt được các xu hướng chính
- Kiểm soát rủi ro hoàn hảo: Sử dụng nhiều phương pháp dừng lỗ để kiểm soát rủi ro giảm giá hiệu quả
- Khả năng thích ứng: Các tham số chiến lược có thể được điều chỉnh để thích ứng với các môi trường thị trường khác nhau
- Thực hiện rõ ràng: các điều kiện tạo tín hiệu rõ ràng, tránh nhiễu do phán đoán chủ quan
Rủi ro chiến lược
- Rủi ro độ trễ: Đường trung bình động có độ trễ và bạn có thể bỏ lỡ thời điểm vào lệnh tốt nhất.
- Rủi ro thị trường chấn động: Trong thị trường chấn động ngang, có thể có nhiều tín hiệu phá vỡ giả
- Rủi ro tối ưu hóa tham số: tham số tối ưu hóa quá mức có thể dẫn đến quá phù hợp, ảnh hưởng đến sự ổn định của chiến lược
- Rủi ro kiểm soát chi phí: giao dịch thường xuyên có thể dẫn đến chi phí giao dịch cao hơn
- Tùy thuộc vào môi trường thị trường: Chiến lược hoạt động tốt hơn trong thị trường có xu hướng rõ ràng, nhưng có thể không hiệu quả trong các môi trường thị trường khác
Hướng tối ưu hóa chiến lược
- Tiến hành chỉ số giao dịch: tăng xác nhận giao dịch trong hệ thống tín hiệu hiện có, tăng độ tin cậy tín hiệu
- Tối ưu hóa tham số thích ứng: phát triển cơ chế điều chỉnh động tham số, nâng cao khả năng thích ứng của chiến lược với thị trường
- Tăng các chỉ số cảm xúc thị trường: giới thiệu các chỉ số cảm xúc như VIX, tối ưu hóa thời gian nhập cảnh
- Cải thiện cơ chế dừng lỗ: Phát triển các giải pháp dừng lỗ linh hoạt hơn, chẳng hạn như dừng lỗ động dựa trên ATR
- Thêm bộ lọc biến động: điều chỉnh vị trí trong môi trường biến động cao, tối ưu hóa tỷ lệ lợi nhuận rủi ro
Tóm tắt
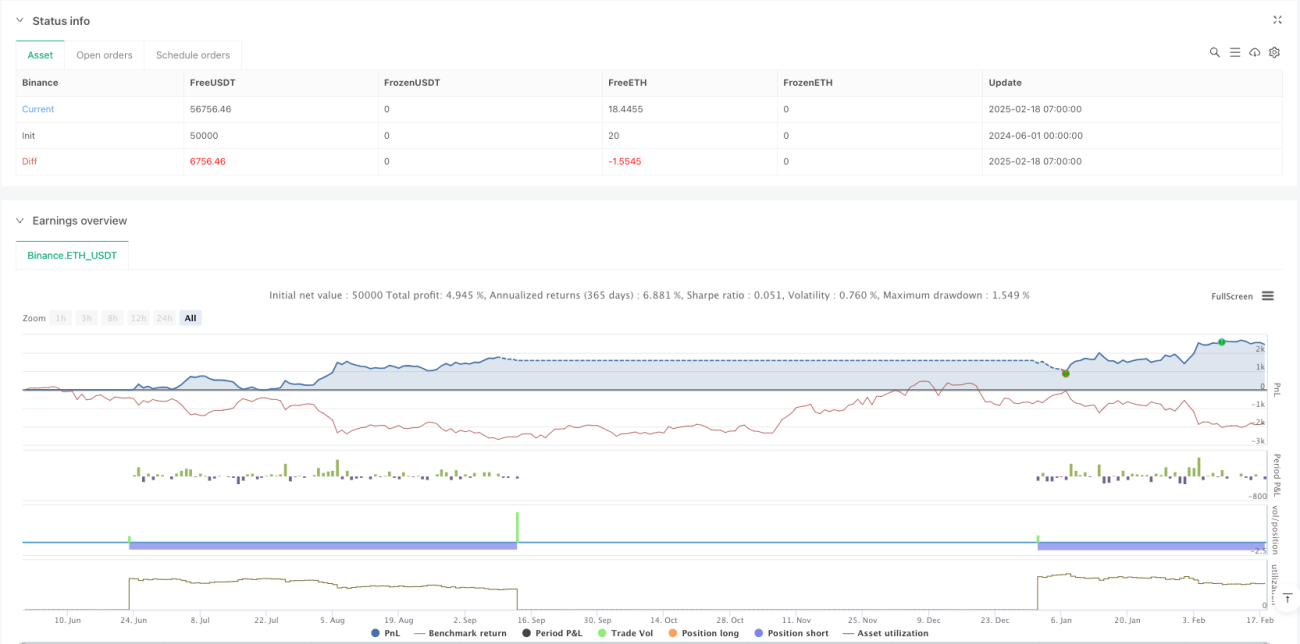
Chiến lược này xây dựng một hệ thống giao dịch tương đối hoàn chỉnh thông qua sự phối hợp hợp của nhiều chỉ số kỹ thuật. Chiến lược này hoạt động tốt trong thị trường có xu hướng rõ ràng, nhưng vẫn cần điều chỉnh tối ưu hóa theo tình hình thị trường thực tế.
- 1