Chiến lược theo dõi xu hướng độ lệch chuẩn của dải Bollinger ba

Tổng quan
Chiến lược này là một hệ thống giao dịch theo dõi xu hướng dựa trên chênh lệch tiêu chuẩn của Brin. Chiến lược này đánh giá sức mạnh của xu hướng bằng cách quan sát mối quan hệ giữa ba đường dây liên tiếp với vị trí của Brin trên đường ray xuống và giao dịch khi xu hướng được thiết lập. Hệ thống sử dụng tỷ lệ lợi nhuận rủi ro cố định để quản lý rủi ro cho mỗi giao dịch.
Nguyên tắc chiến lược
Logic cốt lõi của chiến lược này dựa trên những điểm sau:
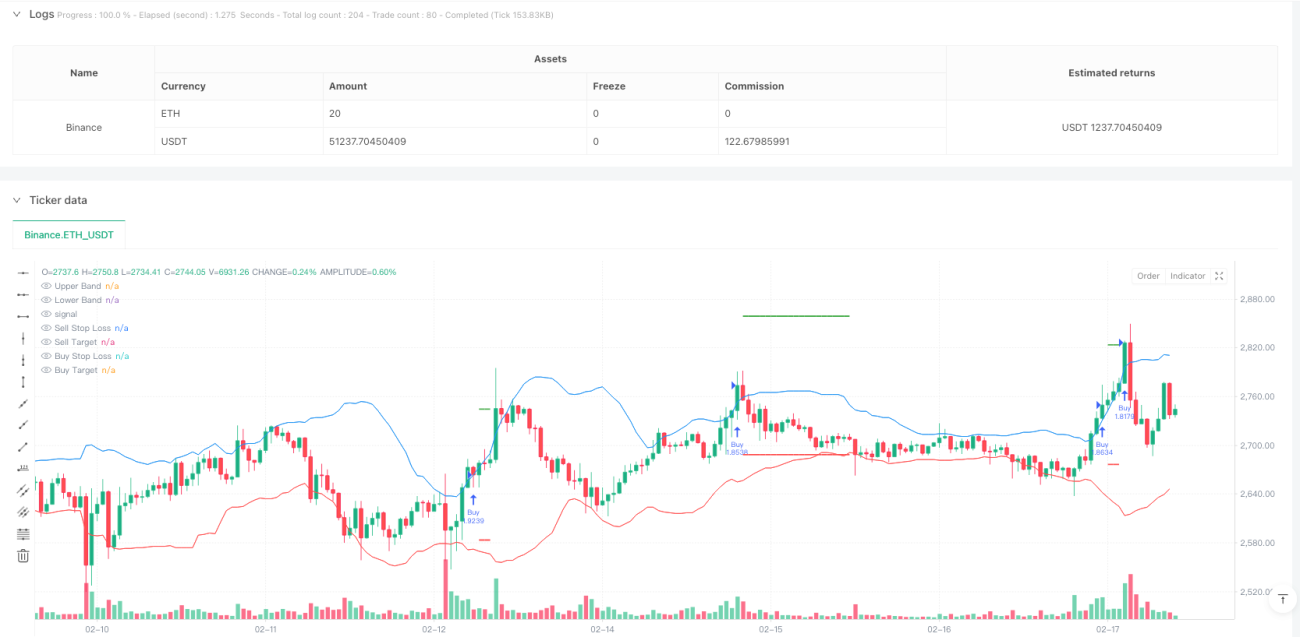
- Sử dụng trung bình di chuyển 20 chu kỳ làm đường ray trung tâm của băng Bryn, và sử dụng chênh lệch tiêu chuẩn gấp 2 lần để tính toán đường ray lên xuống.
- Khi giá đóng cửa của ba dây chuyền liên tiếp nằm trên đường ray, hệ thống cho rằng xu hướng tăng đã được thiết lập, và tham gia vào khi dây chuyền thứ ba đóng cửa.
- Khi giá đóng cửa của ba dây chuyền liên tiếp nằm dưới đường ray, hệ thống cho rằng xu hướng giảm đã được thiết lập, và vào lỗ khi dây chuyền thứ ba đóng cửa.
- Đặt điểm dừng ở cực của đường dây đầu tiên trong tín hiệu vào.
- Định mức giá mục tiêu sử dụng tỷ lệ lợi nhuận rủi ro 1: 1, tức là khoảng cách mục tiêu lợi nhuận bằng khoảng cách dừng lỗ.
Lợi thế chiến lược
- Cơ chế xác nhận tín hiệu mạnh mẽ - yêu cầu ba đường dây liên tiếp vượt qua vùng Brin, giảm hiệu quả nguy cơ đột phá giả.
- Quản lý rủi ro hợp lý - Quản lý giao dịch bằng tỷ lệ lợi nhuận rủi ro cố định, tránh tổn thất quá mức cho mỗi giao dịch.
- Hiệu quả theo dõi xu hướng là đáng kể - đặc tính chênh lệch tiêu chuẩn của Brin Belt cho phép chiến lược thích ứng với sự thay đổi của biến động thị trường.
- Quy tắc thực hiện rõ ràng - Đặt mục tiêu nhập cảnh, dừng lỗ và lợi nhuận có tiêu chuẩn định lượng rõ ràng, không cần phán đoán chủ quan.
Rủi ro chiến lược
- Thị trường ngang hoạt động kém - có thể tạo ra các tín hiệu sai thường xuyên trong thị trường không có xu hướng rõ ràng.
- Thời gian nhập học bị trì hoãn - phải chờ ba đường dây xác nhận để nhập học, có thể bỏ lỡ một số giai đoạn đầu của hành trình.
- Hạn chế tỷ lệ lợi nhuận rủi ro cố định - tỷ lệ lợi nhuận rủi ro 1: 1 có thể kết thúc quá sớm trong một xu hướng mạnh.
- Thiếu bộ lọc cường độ xu hướng - chỉ dựa vào mối quan hệ của giá với các vùng Brin, không xem xét các chỉ số xác nhận xu hướng khác.
Hướng tối ưu hóa chiến lược
- Thêm bộ lọc cường độ xu hướng - có thể giới thiệu các chỉ số xu hướng như ADX hoặc MACD để cải thiện chất lượng tín hiệu.
- Cài đặt tỷ lệ lợi nhuận rủi ro tối ưu hóa - có thể điều chỉnh tỷ lệ lợi nhuận rủi ro theo biến động của thị trường.
- Cải thiện các cơ chế dừng - Xem xét tăng các cơ chế dừng di động hoặc thu lợi nhuận theo từng đợt để nắm bắt tốt hơn các xu hướng lớn.
- Thêm xác nhận khối lượng giao dịch - Tăng xác nhận đột phá khối lượng giao dịch khi tạo tín hiệu, tăng độ tin cậy tín hiệu.
Tóm tắt
Đây là một chiến lược theo dõi xu hướng được thiết kế hợp lý, để nắm bắt xu hướng thị trường thông qua dây chuyền Brin và cơ chế xác nhận đa dạng. Khung quản lý rủi ro của chiến lược được hoàn thiện, tiêu chuẩn thực hiện rõ ràng. Mặc dù có một số sự chậm trễ, nhưng hướng tối ưu hóa được đề xuất có thể nâng cao hơn nữa sự ổn định và khả năng sinh lợi của chiến lược. Đây là một khung chiến lược đáng xem xét cho các nhà giao dịch ưa thích theo dõi xu hướng, chú ý đến kiểm soát rủi ro.
/*backtest
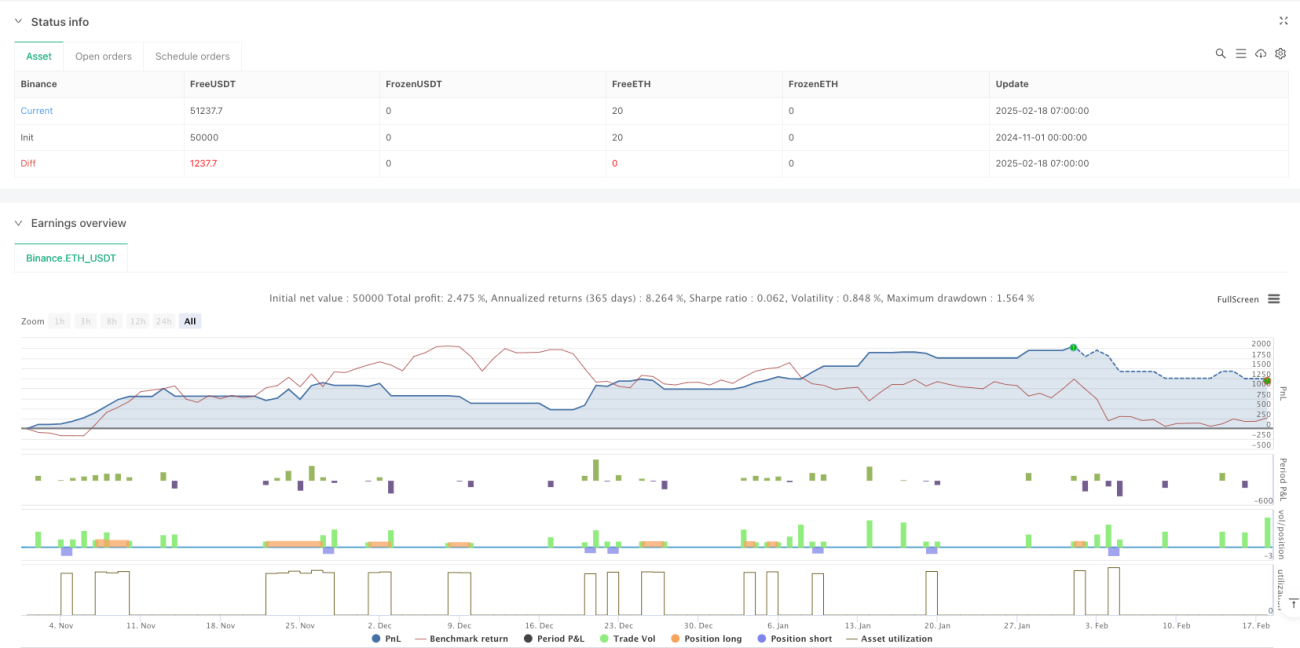
start: 2024-11-01 00:00:00
end: 2025-02-18 08:00:00
period: 1h
basePeriod: 1h
exchanges: [{"eid":"Binance","currency":"ETH_USDT"}]
*/
//@version=6
strategy("Bollinger Band Buy and Sell Strategy (Entry at Close of 3rd Candle)", overlay=true, default_qty_type=strategy.percent_of_equity, default_qty_value=10, pyramiding=0)
// Bollinger Band settings- 1