
Tổng quan
Chiến lược này là một hệ thống giao dịch tổng hợp đa chỉ số, kết hợp các chỉ số kỹ thuật như đường trung bình di chuyển của chỉ số (EMA), chỉ số tương đối mạnh (RSI) và độ sóng thực trung bình (ATR), và giới thiệu chỉ số xu hướng trung bình (ADX) để tăng cường độ chính xác trong việc đánh giá xu hướng. Hệ thống xác nhận thời điểm đặt vị trí thông qua nhiều tín hiệu và sử dụng ATR để quản lý động lỗ và dừng để kiểm soát rủi ro hiệu quả.
Nguyên tắc chiến lược
Chiến lược này tập trung vào việc nắm bắt xu hướng thị trường và giao dịch thông qua sự kết hợp của nhiều chỉ số kỹ thuật, bao gồm:
- Sử dụng EMA nhanh (trong 20 chu kỳ) và chậm (trong 50 chu kỳ) để xác định xu hướng
- Kết hợp với ADX ((14 chu kỳ) xác nhận cường độ của xu hướng, yêu cầu ADX> 20 để xác nhận xu hướng có hiệu lực
- Sử dụng RSI (thời kỳ 14) để tìm kiếm cơ hội mua và bán quá mức, RSI vượt quá 30 kích thích mua và giảm dưới 70 kích thích bán
- Sử dụng ATR (14 chu kỳ) để tính toán các vị trí dừng và dừng động, tỷ lệ lợi nhuận rủi ro được thiết lập là 2: 1
Lợi thế chiến lược
- Xác nhận tín hiệu đa dạng giúp tăng độ chính xác giao dịch và tránh tín hiệu giả
- Việc đưa ra chỉ số ADX giúp tăng độ tin cậy trong việc đánh giá xu hướng
- Cơ chế dừng lỗ động thích ứng với sự biến động của thị trường
- Kiểm soát rủi ro nghiêm ngặt đảm bảo rủi ro của mỗi giao dịch
- Logic chiến lược rõ ràng và các thông số có thể điều chỉnh cao
Rủi ro chiến lược
- Nhiều chỉ số có thể làm chậm tín hiệu và ảnh hưởng đến thời gian nhập cảnh
- Có thể xảy ra giao dịch thường xuyên trong thị trường bất ổn
- Chỉ số ADX có thể tạo ra tín hiệu chậm trễ trong một số điều kiện thị trường
- Cài đặt tham số cần được tối ưu hóa cho các môi trường thị trường khác nhau
Hướng tối ưu hóa chiến lược
- Xem xét thêm các chỉ số giao dịch để tăng cường tín hiệu đáng tin cậy
- Tiến hành bộ lọc tỷ lệ biến động thị trường, điều chỉnh vị trí trong thời gian biến động cao
- Phát triển cơ chế tham số thích ứng, điều chỉnh theo tình trạng thị trường
- Tăng phân cấp cường độ xu hướng, thực hiện quản lý động vị trí
- Tối ưu hóa logic dừng lỗ, giới thiệu cơ chế dừng lỗ di động
Tóm tắt
Chiến lược này xây dựng một hệ thống giao dịch theo dõi xu hướng hoàn chỉnh thông qua sự kết hợp hữu cơ của nhiều chỉ số kỹ thuật. Chiến lược đảm bảo tính chính xác của giao dịch, đồng thời đảm bảo an toàn của giao dịch thông qua kiểm soát rủi ro nghiêm ngặt. Mặc dù có một số không gian tối ưu hóa, nhưng khung tổng thể có giá trị thực tế và khả năng mở rộng tốt.
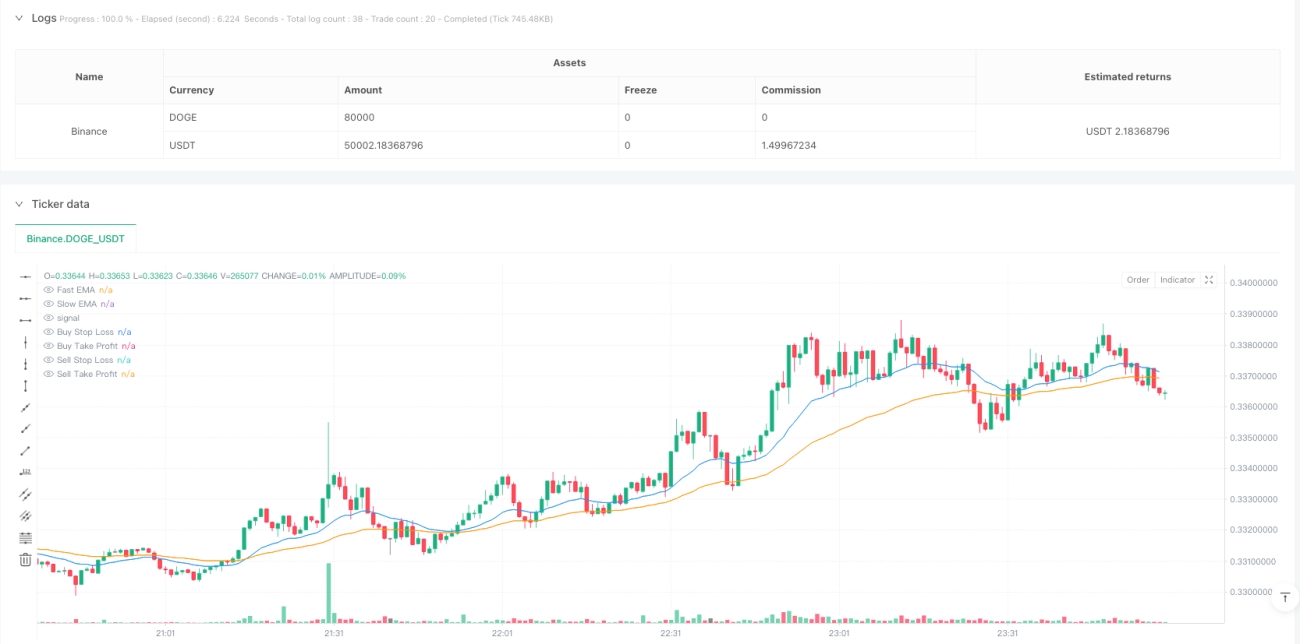
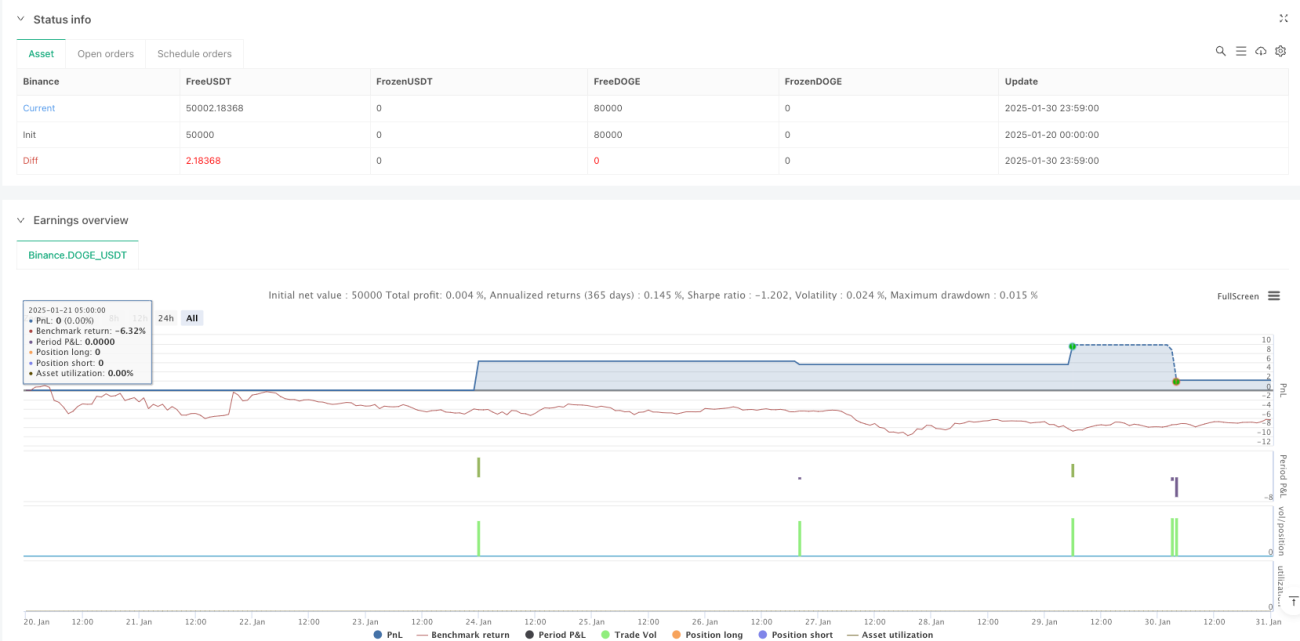
/*backtest
start: 2025-01-20 00:00:00
end: 2025-01-31 00:00:00
period: 1m
basePeriod: 1m
exchanges: [{"eid":"Binance","currency":"DOGE_USDT"}]
*/

//@version=5
strategy("Enhanced GBP/USD Strategy with ADX", overlay=true, default_qty_type=strategy.percent_of_equity, default_qty_value=1)

// === Input Parameters ===- 1