Giao thoa xu hướng nhiều chỉ báo kết hợp với chiến lược biến động động ATR

RSI SMA MACD ATR MA TP SL
Ngày tạo: 2025-02-20 16:28:37 sửa đổi lần cuối: 2025-02-27 17:30:15
sao chép: 0 Số nhấp chuột: 366
2
tập trung vào
319
Người theo dõi

Giao thoa xu hướng nhiều chỉ báo kết hợp với chiến lược biến động động ATR Giao thoa xu hướng nhiều chỉ báo kết hợp với chiến lược biến động động ATR

Tổng quan

Chiến lược này là một hệ thống theo dõi xu hướng kết hợp nhiều chỉ số kỹ thuật. Nó chủ yếu dựa trên tín hiệu chéo của RSI, MACD và SMA để xác định hướng giao dịch, đồng thời sử dụng chỉ số ATR để điều chỉnh động mức dừng lỗ và lợi nhuận.

Nguyên tắc chiến lược

Chiến lược này sử dụng hệ thống xác minh ba lần để xác nhận tín hiệu giao dịch:

  1. Định hướng xu hướng chính thông qua mối quan hệ vị trí của đường trung bình 50 và 200
  2. Sử dụng RSI để tìm thời gian vào trong khu vực giao thoa mua quá mức
  3. Kết hợp với MACD để xác nhận động lực xu hướng
  4. Sử dụng bộ lọc khối lượng giao dịch để đảm bảo đủ thanh khoản thị trường
  5. Thiết lập mục tiêu dừng lỗ và lợi nhuận động dựa trên ATR

Mục đích của xác minh nhiều lần là để giảm tín hiệu giả và tăng độ chính xác của giao dịch. Chiến lược mở vị trí khi thực hiện nhiều điều kiện đáp ứng ((trend up + RSI vượt qua 40 + MACD up + xác nhận khối lượng giao dịch) và sử dụng ATR gấp 2 lần để dừng lỗ và gấp 4 lần để dừng).

Lợi thế chiến lược

  1. Xác thực chéo đa chỉ số kỹ thuật, giảm hiệu quả tín hiệu giả
  2. Cơ chế dừng biến động động, thích ứng với các môi trường thị trường khác nhau
  3. Sử dụng chiến lược dừng một phần, khóa một phần lợi nhuận trong khi vẫn giữ được không gian để tăng
  4. Bộ lọc khối lượng giao dịch đảm bảo đủ thanh khoản thị trường
  5. Hệ thống quản lý rủi ro đầy đủ, bao gồm dừng cố định, theo dõi dừng lỗ và phần lợi nhuận

Rủi ro chiến lược

  1. Nhiều chỉ số có thể làm mất đi một số cơ hội giao dịch
  2. Có thể bị sụt giảm lớn trong thị trường biến động
  3. Tối ưu hóa tham số quá mức có thể dẫn đến quá khớp
  4. Bộ lọc khối lượng giao dịch có thể bỏ lỡ cơ hội trong thị trường thiếu thanh khoản
  5. Hạn chế động lực có thể được kích hoạt quá sớm trong thời gian biến động cao

Hướng tối ưu hóa chiến lược

  1. Cân nhắc thêm cơ chế thích ứng biến động thị trường, điều chỉnh các tham số động trong môi trường biến động khác nhau
  2. Nhập phân tích đa chu kỳ để tăng độ chính xác trong việc đánh giá xu hướng
  3. Tối ưu hóa tỷ lệ dừng một phần, điều chỉnh chiến lược dừng trong các môi trường thị trường khác nhau
  4. Tăng bộ lọc cường độ xu hướng để tránh giao dịch trong môi trường xu hướng yếu
  5. Xem xét thêm phân tích yếu tố theo mùa để tối ưu hóa thời gian giao dịch

Tóm tắt

Đây là một chiến lược theo dõi xu hướng toàn diện, xây dựng một hệ thống giao dịch vững chắc thông qua việc sử dụng kết hợp nhiều chỉ số kỹ thuật. Đặc điểm chính của chiến lược là thích ứng với sự thay đổi của thị trường thông qua cơ chế dừng lỗ và lợi nhuận động, đồng thời đảm bảo sự an toàn. Mặc dù có một số nơi cần được tối ưu hóa, nhưng khung tổng thể là hợp lý, phù hợp để hoàn thiện và thử nghiệm thực tế hơn nữa.
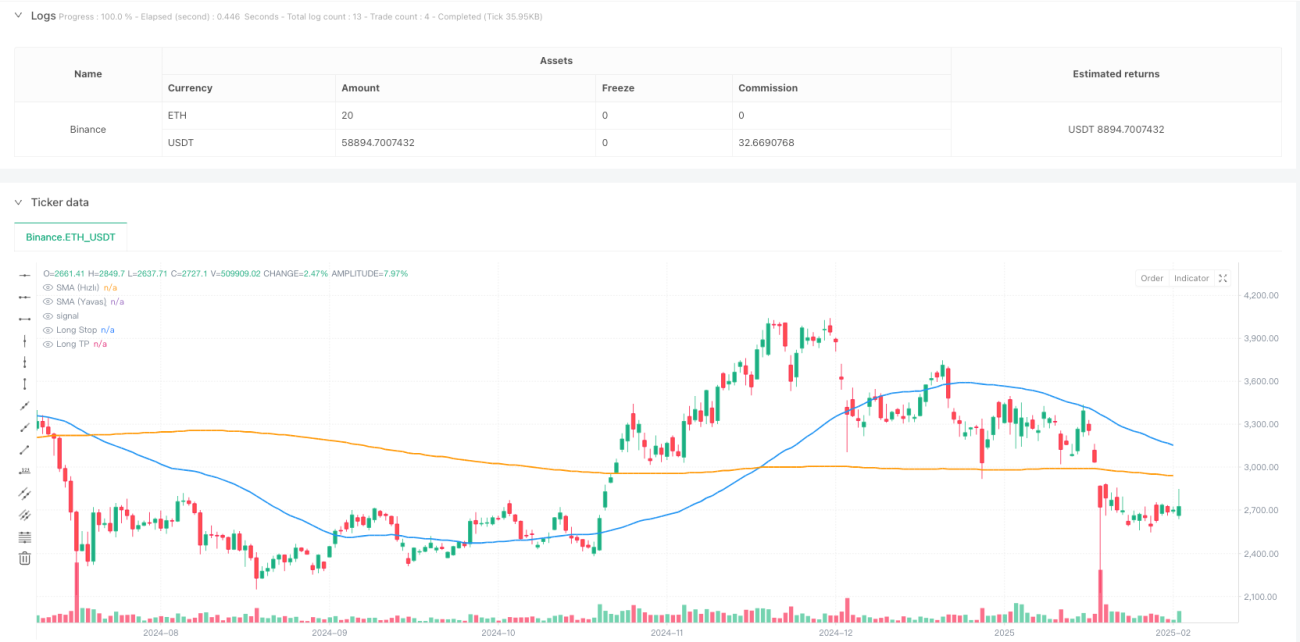
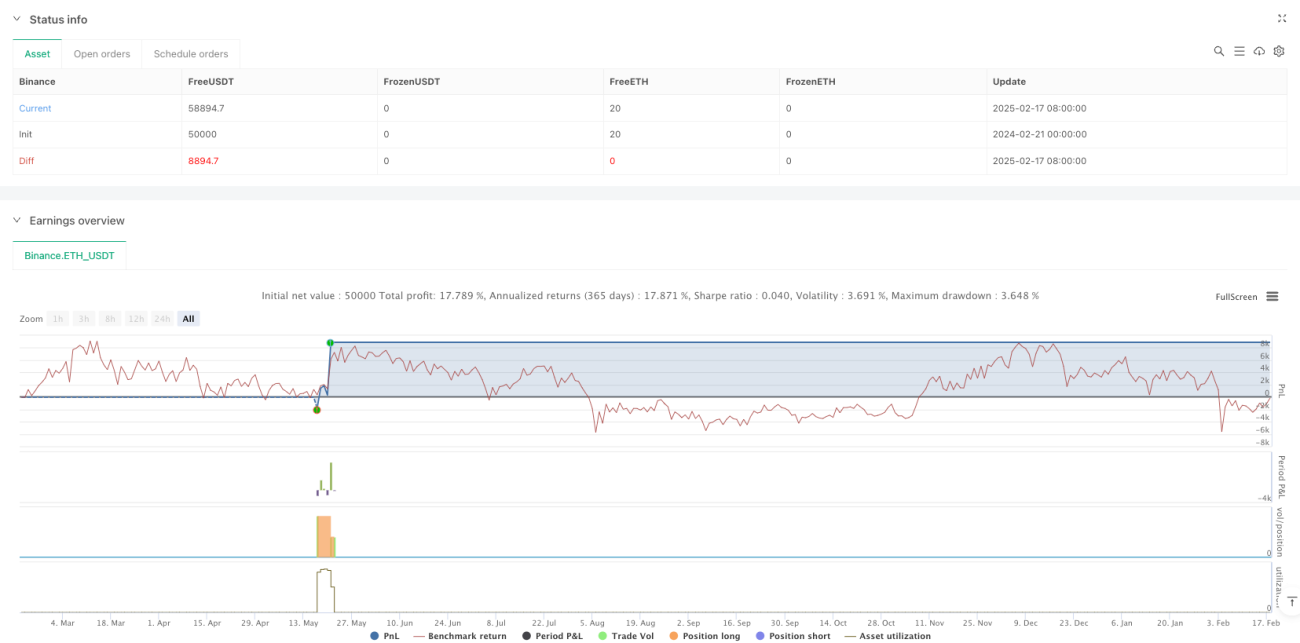
Mã nguồn chiến lược
/*backtest
start: 2024-02-21 00:00:00
end: 2025-02-18 08:00:00
period: 1d
basePeriod: 1d
exchanges: [{"eid":"Binance","currency":"ETH_USDT"}]
*/

//@version=5
strategy(    title="AI Trade Strategy v2 (Extended) - Fixed",    shorttitle="AI_Trade_v2",    overlay=true,    format=format.price,    initial_capital=100000,    default_qty_type=strategy.percent_of_equity,    default_qty_value=100,    pyramiding=0)

//============================================================================
//=== 1) Basic Indicators (SMA, RSI, MACD) ==================================
//============================================================================

// Time Filter (optional, you can update)
inDateRange = (time >= timestamp("2018-01-01T00:00:00")) and (time <= timestamp("2069-01-01T00:00:00"))

// RSI Parameters
rsiLength  = input.int(14, "RSI Period")
rsiOB      = input.int(60, "RSI Overbought Level")
rsiOS      = input.int(40, "RSI Oversold Level")
rsiSignal  = ta.rsi(close, rsiLength)

// SMA Parameters
smaFastLen = input.int(50, "SMA Fast Period")
smaSlowLen = input.int(200, "SMA Slow Period")
smaFast    = ta.sma(close, smaFastLen)
smaSlow    = ta.sma(close, smaSlowLen)

// MACD Parameters
fastLength     = input.int(12, "MACD Fast Period")
slowLength     = input.int(26, "MACD Slow Period")
signalLength   = input.int(9,  "MACD Signal Period")
[macdLine, signalLine, histLine] = ta.macd(close, fastLength, slowLength, signalLength)

//============================================================================
//=== 2) Additional Filter (Volume) ========================================
//============================================================================
useVolumeFilter    = input.bool(true, "Use Volume Filter?")
volumeMaPeriod     = input.int(20, "Volume MA Period")
volumeMa           = ta.sma(volume, volumeMaPeriod)

// If volume filter is enabled, current bar volume should be greater than x times the average volume
volMultiplier = input.float(1.0, "Volume Multiplier (Volume > x * MA)")
volumeFilter  = not useVolumeFilter or (volume > volumeMa * volMultiplier)

//============================================================================
//=== 3) Trend Conditions (SMA) ============================================
//============================================================================
isBullTrend = smaFast > smaSlow
isBearTrend = smaFast < smaSlow

//============================================================================
//=== 4) Entry Conditions (RSI + MACD + Trend + Volume) ====================
//============================================================================

// RSI crossing above 30 + Bullish Trend + Positive MACD + Volume Filter
longCondition = isBullTrend    and ta.crossover(rsiSignal, rsiOS)    and (macdLine > signalLine)    and volumeFilter 
shortCondition = isBearTrend    and ta.crossunder(rsiSignal, rsiOB)    and (macdLine < signalLine)    and volumeFilter

//============================================================================
//=== 5) ATR-based Stop + Trailing Stop ===================================
//============================================================================
atrPeriod       = input.int(14, "ATR Period")
atrMultiplierSL = input.float(2.0, "Stop Loss ATR Multiplier")
atrMultiplierTP = input.float(4.0, "Take Profit ATR Multiplier")

atrValue = ta.atr(atrPeriod)

//============================================================================
//=== 6) Trade (Position) Management ======================================
//============================================================================
if inDateRange
    //--- Long Entry ---
    if longCondition
        strategy.entry(id="Long", direction=strategy.long, comment="Long Entry")

    //--- Short Entry ---
    if shortCondition
        strategy.entry(id="Short", direction=strategy.short, comment="Short Entry")

    //--- Stop & TP for Long Position ---
    if strategy.position_size > 0
        // ATR-based fixed Stop & TP calculation
        longStopPrice  = strategy.position_avg_price - atrValue * atrMultiplierSL
        longTakeProfit = strategy.position_avg_price + atrValue * atrMultiplierTP

        // PARTIAL EXIT: (Example) take 50% of the position at early TP
        partialTP = strategy.position_avg_price + (atrValue * 2.5)
        strategy.exit(            id         = "Partial TP Long",            stop       = na,            limit      = partialTP,            qty_percent= 50,            from_entry = "Long"        )

        // Trailing Stop + Final ATR Stop
        // WARNING: trail_offset=... is the offset in price units.
        // For example, in BTCUSDT, a value like 300 means a 300 USDT trailing distance.
        float trailingDist = atrValue * 1.5
        strategy.exit(            id          = "Long Exit (Trail)",            stop        = longStopPrice,            limit       = longTakeProfit,            from_entry  = "Long",            trail_offset= trailingDist        )

    //--- Stop & TP for Short Position ---
    if strategy.position_size < 0
        // ATR-based fixed Stop & TP calculation for Short
        shortStopPrice  = strategy.position_avg_price + atrValue * atrMultiplierSL
        shortTakeProfit = strategy.position_avg_price - atrValue * atrMultiplierTP

        // PARTIAL EXIT: (Example) take 50% of the position at early TP
        partialTPShort = strategy.position_avg_price - (atrValue * 2.5)
        strategy.exit(            id         = "Partial TP Short",            stop       = na,            limit      = partialTPShort,            qty_percent= 50,            from_entry = "Short"        )

        // Trailing Stop + Final ATR Stop for Short
        float trailingDistShort = atrValue * 1.5
        strategy.exit(            id          = "Short Exit (Trail)",            stop        = shortStopPrice,            limit       = shortTakeProfit,            from_entry  = "Short",            trail_offset= trailingDistShort        )

//============================================================================
//=== 7) Plot on Chart (SMA, etc.) =========================================
//============================================================================
plot(smaFast, color=color.blue,   linewidth=2, title="SMA (Fast)")
plot(smaSlow, color=color.orange, linewidth=2, title="SMA (Slow)")

// (Optional) Plot Stop & TP levels dynamically:
longStopForPlot  = strategy.position_size > 0 ? strategy.position_avg_price - atrValue * atrMultiplierSL : na
longTPForPlot    = strategy.position_size > 0 ? strategy.position_avg_price + atrValue * atrMultiplierTP : na
shortStopForPlot = strategy.position_size < 0 ? strategy.position_avg_price + atrValue * atrMultiplierSL : na
shortTPForPlot   = strategy.position_size < 0 ? strategy.position_avg_price - atrValue * atrMultiplierTP : na

plot(longStopForPlot,  color=color.red,   style=plot.style_linebr, title="Long Stop")
plot(longTPForPlot,    color=color.green, style=plot.style_linebr, title="Long TP")
plot(shortStopForPlot, color=color.red,   style=plot.style_linebr, title="Short Stop")
plot(shortTPForPlot,   color=color.green, style=plot.style_linebr, title="Short TP")