
Tổng quan
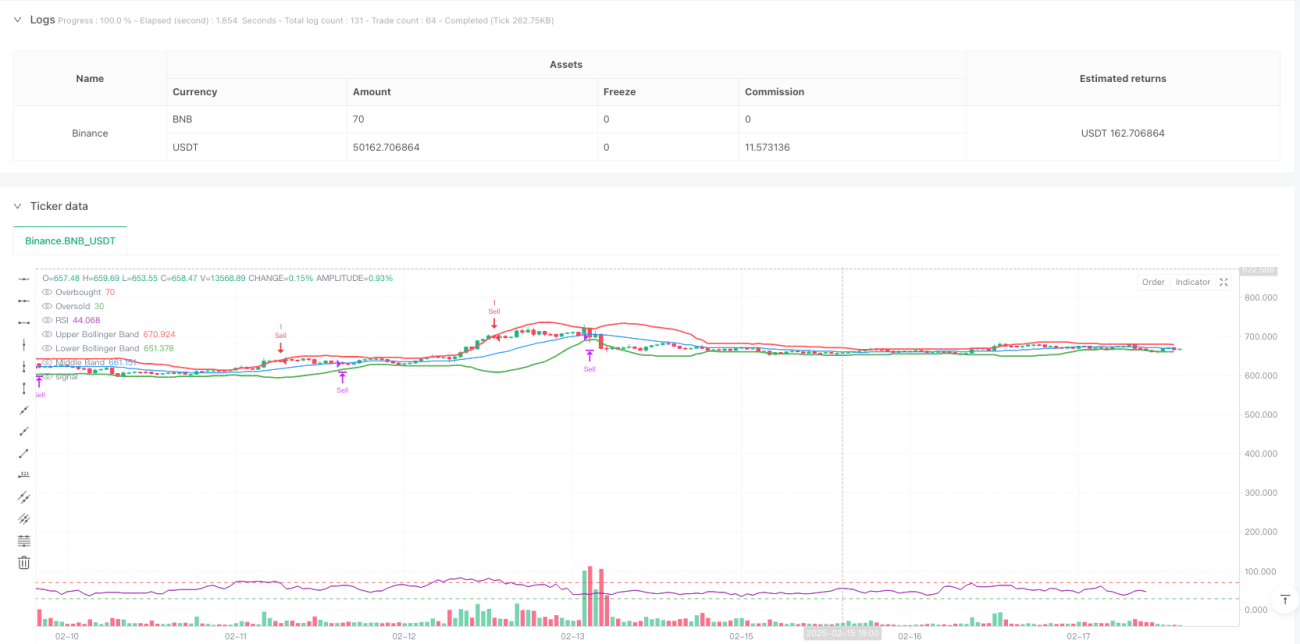
Chiến lược này là một hệ thống giao dịch phân tích kỹ thuật kết hợp các dải Bollinger Bands và các chỉ số tương đối mạnh RSI. Nó chủ yếu sử dụng tính năng biến động giá và động lực thị trường để tìm kiếm cơ hội giao dịch trong khu vực mua bán quá mức. Chiến lược này tạo ra tín hiệu mua khi chỉ số RSI hiển thị bán quá mức dưới 30 và giá phá vỡ đường dây Bollinger Bands; tạo ra tín hiệu bán khi chỉ số RSI hiển thị mua quá mức trên 70 và giá phá vỡ đường dây Bollinger Bands.
Nguyên tắc chiến lược
Logic cốt lõi của chiến lược này dựa trên các yếu tố chính sau:
- Thiết lập tham số của Brin sử dụng trung bình di chuyển 20 chu kỳ làm đường trung tâm, với hệ số chênh lệch chuẩn là 2.0
- Các tham số RSI sử dụng thiết lập 14 chu kỳ truyền thống
- Điều kiện tham gia:
- Mua: Giá vượt qua Bollinger Bandwagon và RSI <30
- Bán ra: Giá giảm vượt qua Blink và RSI> 70
- Điều kiện xuất phát: giá hòa khi giao thoa với đường trung tâm của băng tần Brin ((20 chu kỳ trung bình di chuyển))
Sự kết hợp này có tính đến cả tính thống kê của giá cả và kết hợp với các chỉ số động lực, làm tăng hiệu quả độ chính xác của giao dịch.
Lợi thế chiến lược
- Cơ chế xác nhận đa dạng: kết hợp giá cả và chỉ số động lực để giảm tín hiệu giả
- Kiểm soát rủi ro hợp lý: Sử dụng đường ray trung tâm của băng tần Brin như điểm dừng lỗ, bảo vệ lợi nhuận và kiểm soát rủi ro
- Khả năng thích ứng: Brinband tự động điều chỉnh băng thông theo biến động của thị trường
- Thiết lập tham số cổ điển: sử dụng các tham số được xác minh rộng rãi để tăng sự ổn định của chiến lược
- logic rõ ràng: các quy tắc giao dịch rõ ràng, dễ dàng để tra cứu và hoạt động trên thực tế
Rủi ro chiến lược
- Rủi ro thị trường chấn động: Có thể có tín hiệu giao dịch thường xuyên trong thị trường ngang
- Rủi ro thị trường xu hướng: Có thể bỏ lỡ một phần trong xu hướng mạnh
- Tính nhạy cảm của tham số: chu kỳ vòng đai Brin và thiết lập RSI có ảnh hưởng lớn đến hiệu suất chiến lược
- Tác động điểm trượt: Có thể có điểm trượt lớn khi giá dao động nhanh
Các biện pháp sau đây được khuyến nghị để quản lý rủi ro:
- Thiết lập kiểm soát vị trí phù hợp
- Thêm bộ lọc xu hướng
- Cơ chế thích ứng cho các tham số tối ưu hóa
- Đánh giá lại chi phí giao dịch
Hướng tối ưu hóa chiến lược
- Tối ưu hóa tham số động:
- Blink-band tham số được điều chỉnh theo biến động của thị trường
- Điều chỉnh RSI theo môi trường thị trường
- Thêm các chỉ số hỗ trợ:
- Thêm xác nhận số lượng giao dịch
- Xem xét các chỉ số xu hướng như một bộ lọc
- Cải thiện cơ chế dừng lỗ:
- Tiếp tục theo dõi
- Đặt giới hạn tổn thất tối đa
- Tối ưu hóa giao dịch:
- Thực hiện giao dịch vị thế một phần
- Thêm logic tối ưu hóa giá vào cửa
Tóm tắt
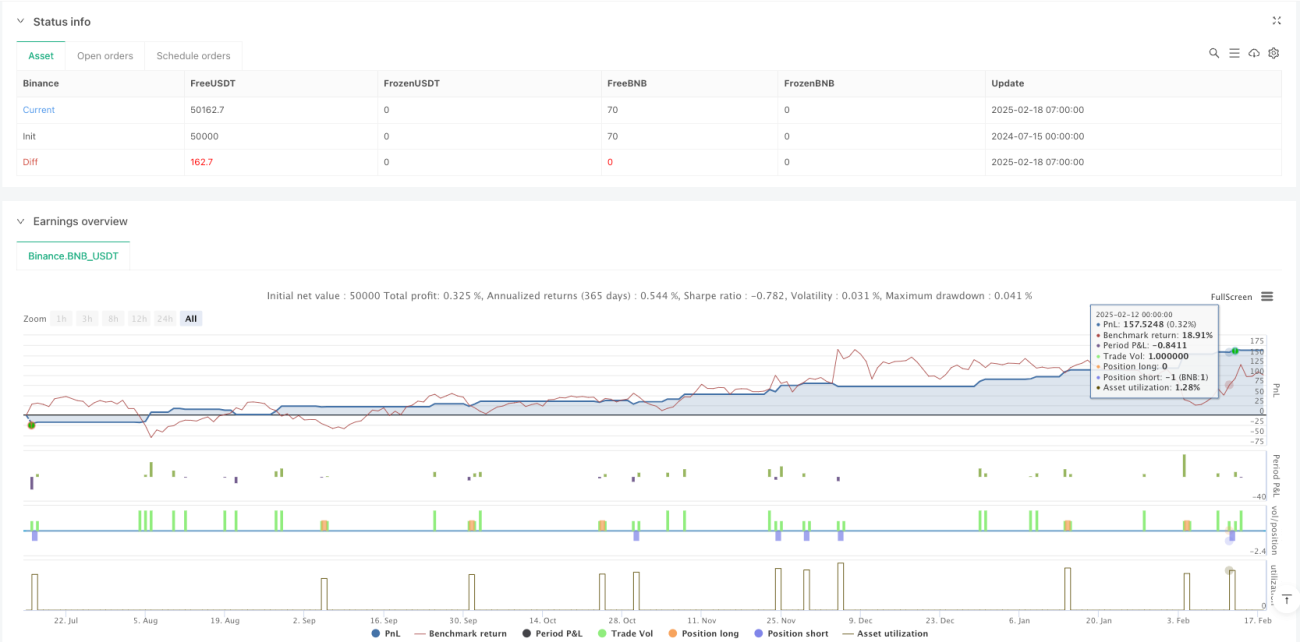
Chiến lược này được kết hợp với các chỉ số Brin và RSI để xây dựng một hệ thống giao dịch tương đối hoàn chỉnh. Logic của chiến lược rõ ràng, kiểm soát rủi ro hợp lý và có giá trị thực tế nhất định. Với hướng tối ưu hóa được đề xuất, chiến lược vẫn còn chỗ để nâng cao hơn nữa.
- 1