Chiến lược theo dõi xu hướng chéo đa chỉ báo kết hợp với Fibonacci thoái lui và hệ thống tối ưu hóa dừng lỗ và dừng lãi

Tổng quan
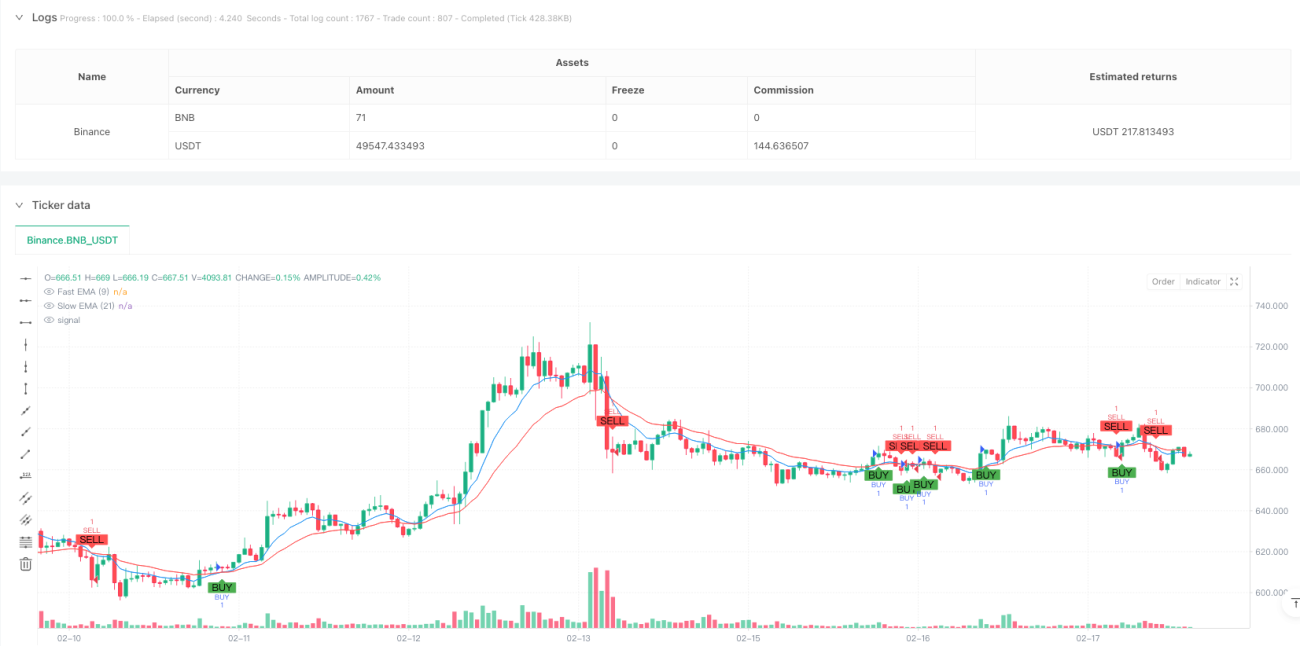
Chiến lược này là một hệ thống giao dịch tổng hợp kết hợp các đường trung bình di chuyển của chỉ số (EMA), mức độ Fibonacci, phán đoán xu hướng và cơ chế dừng lỗ. Chiến lược xác định tín hiệu giao dịch thông qua các đường trung bình di chuyển của 9 chu kỳ và 21 chu kỳ EMA, đồng thời kết hợp với mức độ Fibonacci để tối ưu hóa vị trí đầu vào và tăng độ chính xác của giao dịch thông qua giám sát trạng thái xu hướng trong thời gian thực. Hệ thống cũng tích hợp cơ chế dừng lỗ phần trăm, kiểm soát rủi ro hiệu quả.
Nguyên tắc chiến lược
Logic cốt lõi của chiến lược này dựa trên các yếu tố chính sau:
- Hệ thống tạo ra nhiều tín hiệu khi tốc độ EMA ((9 chu kỳ) vượt qua tốc độ EMA ((21 chu kỳ)
- Khi EMA nhanh đi xuống qua EMA chậm, hệ thống tạo ra một tín hiệu trống
- Bằng cách tính giá cao nhất và giá thấp nhất trong 100 chu kỳ, vẽ mức Fibonacci điều chỉnh 23,6%, 38,2%, 50% và 61,8%
- Xác định tình trạng xu hướng hiện tại bằng cách kết thúc giá với vị trí của EMA nhanh
- Khi giao dịch được thực hiện, hệ thống tự động thiết lập mức dừng cố định phần trăm ((4%) và mức dừng lỗ ((2%)
Lợi thế chiến lược
- Xác nhận tín hiệu đa chiều: kết hợp với EMA crossover, mức Fibonacci và trạng thái xu hướng, cung cấp tín hiệu giao dịch đáng tin cậy hơn
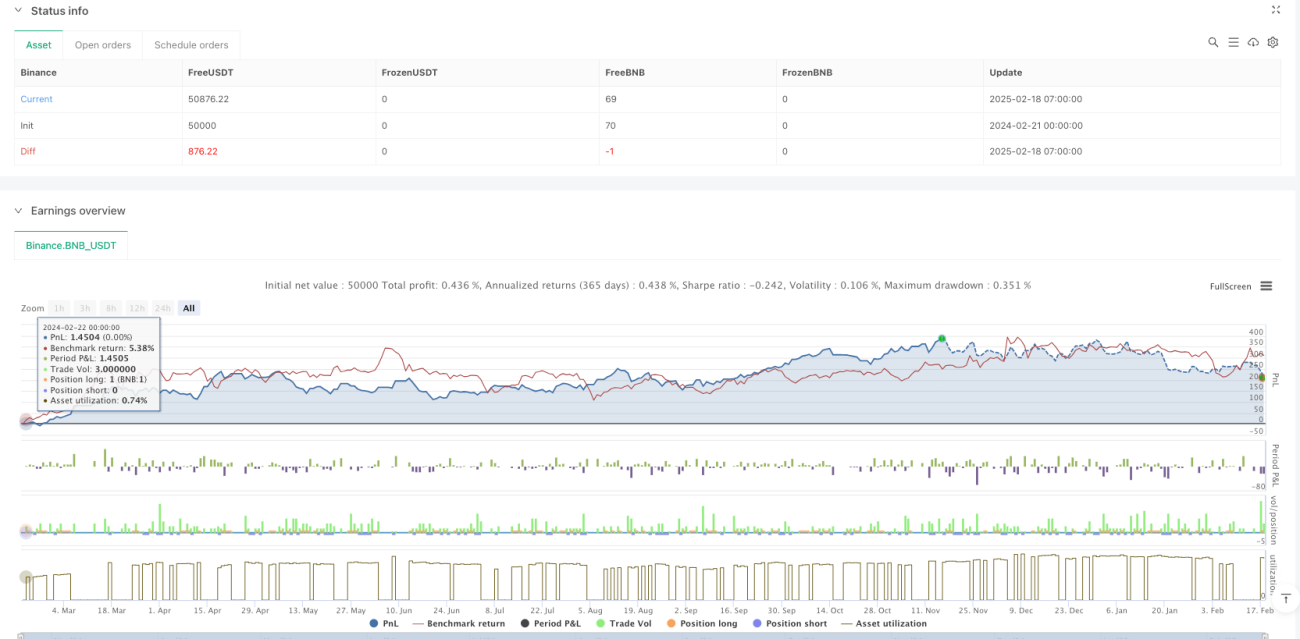
- Quản lý rủi ro hoàn thiện: kiểm soát rủi ro tự động bằng cách đặt trước tỷ lệ dừng lỗ
- Khả năng theo dõi xu hướng mạnh mẽ: EMA chéo kết hợp với định vị xu hướng, có thể nắm bắt được xu hướng thị trường một cách hiệu quả
- Trả lời trực quan rõ ràng: Thể hiện các mức giá quan trọng, tình trạng xu hướng và tín hiệu giao dịch thông qua các thẻ để hỗ trợ quyết định giao dịch
- Mức độ hệ thống hóa cao: logic giao dịch rõ ràng, giảm nhiễu từ phán đoán chủ quan
Rủi ro chiến lược
- Rủi ro thị trường dao động: Thường xuyên giao dịch trên EMA có thể dẫn đến tín hiệu sai
- Rủi ro bị tụt hậu: Đường trung bình di chuyển là một chỉ số bị tụt hậu, có thể bỏ lỡ thời điểm tốt nhất để tham gia
- Rủi ro dừng cố định: Lãi suất dừng cố định có thể không phù hợp với tất cả các điều kiện thị trường
- Rủi ro xung đột tín hiệu: Có thể có các tín hiệu mâu thuẫn giữa nhiều chỉ số, làm tăng khó khăn trong việc ra quyết định
- Rủi ro biến động thị trường: biến động mạnh có thể dẫn đến điểm dừng không hợp lý
Hướng tối ưu hóa chiến lược
- Tối ưu hóa dừng động: có thể điều chỉnh khoảng cách dừng động theo ATR hoặc biến động của thị trường
- Tăng cường lọc tín hiệu: tăng số lượng giao thông, động lực và các chỉ số phụ trợ để lọc tín hiệu giả
- Các tham số tự điều chỉnh: giới thiệu cơ chế tự điều chỉnh, điều chỉnh chu kỳ EMA theo tình hình thị trường
- Tối ưu hóa nhập cảnh: kết hợp hình thức giá cả và khối lượng giao dịch để tối ưu hóa nhập cảnh gần mức Fibonacci
- Quản lý vị trí hoàn thiện: Hệ thống quản lý vị trí động được thiết kế dựa trên biến động và rủi ro tài khoản
Tóm tắt
Chiến lược này xây dựng một hệ thống giao dịch hoàn chỉnh hơn bằng cách tích hợp một số công cụ phân tích kỹ thuật cổ điển. Ưu điểm của nó là tính đa chiều của tín hiệu xác nhận và hệ thống hóa quản lý rủi ro, nhưng vẫn cần tối ưu hóa cho các môi trường thị trường khác nhau.
- 1