
Tổng quan
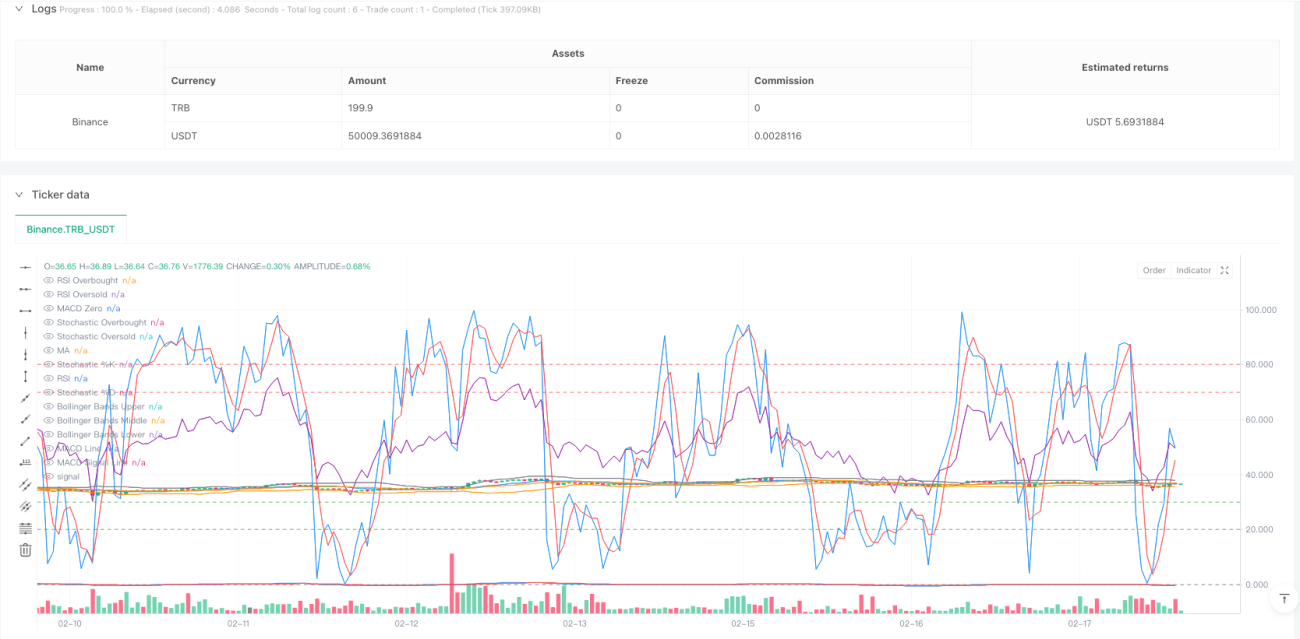
Chiến lược này là một hệ thống giao dịch theo dõi xu hướng dựa trên nhiều chỉ số kỹ thuật, tích hợp nhiều chỉ số kỹ thuật như đường trung bình di chuyển (MA), đường trung bình tương đối mạnh (RSI), đường Brin (BB), đường trung bình di chuyển (MACD) và đường ngẫu nhiên (Stochastic) để xác định xu hướng thị trường và cơ hội giao dịch thông qua xác nhận chéo giữa các chỉ số. Chiến lược này sử dụng phương pháp quản lý vị trí phần trăm, sử dụng tiền mặc định 1% cho mỗi giao dịch.
Nguyên tắc chiến lược
Các chiến lược xác định tín hiệu giao dịch thông qua các chiều sau:
- Sử dụng trung bình di chuyển đơn giản 14 chu kỳ (SMA) làm chuẩn cho xu hướng
- Chỉ số RSI được sử dụng để đánh giá quá mua và quá bán, đặt 30 và 70 là điểm mốc quan trọng
- Đường băng thông Brin được sử dụng để xác định phạm vi dao động của giá, với khoảng thời gian là 20
- Chỉ số MACD ((12,26,9) được sử dụng để xác nhận xu hướng
- Chỉ số ngẫu nhiên ((14,3) được sử dụng để đánh giá động lượng
Một số điều kiện cần được đáp ứng:
- RSI dưới 30 (thua quá mức)
- MACD đường đi qua đường tín hiệu
- Giá trị K ngẫu nhiên dưới 20
- Giá đóng cửa cao hơn đường trung tâm của Brin
- Giá đóng cửa trước đó thấp hơn giá Brin
Điều kiện làm không cần phải đáp ứng:
- RSI cao hơn 70
- MACD đường dưới đường xuyên qua đường tín hiệu
- Giá trị K ngẫu nhiên cao hơn 80
- Giá đóng cửa thấp hơn đường trung tâm của băng tần Brin
- Giá bán cuối cùng cao hơn giá bán thùng Brin
Lợi thế chiến lược
- Xác định chéo nhiều chỉ số kỹ thuật có thể lọc các tín hiệu giả hiệu quả
- Kết hợp theo dõi xu hướng và chỉ số biến động, tính cả xu hướng và biến động
- Sử dụng quản lý tỷ lệ phần trăm để kiểm soát rủi ro hiệu quả
- Các tham số chỉ số có thể điều chỉnh, có khả năng thích ứng tốt
- Tín hiệu giao dịch rõ ràng, dễ thực hiện và dễ truy xuất
Rủi ro chiến lược
- Nhiều chỉ số có thể làm chậm tín hiệu và ảnh hưởng đến thời gian nhập cảnh
- Thị trường chấn động có thể giao dịch thường xuyên, làm tăng chi phí
- Các tham số cố định hoạt động khác nhau trong các môi trường thị trường khác nhau
- Các chỉ số kỹ thuật có thể mâu thuẫn với nhau, gây nhiễu tín hiệu
Những biện pháp sau đây được khuyến cáo để tránh rủi ro:
- Các tham số điều chỉnh động theo các đặc điểm thị trường khác nhau
- Thiết lập Stop Loss Stop để kiểm soát rủi ro
- Kết hợp các chỉ số khác như lưu lượng giao thông để xác nhận tín hiệu
- Thường xuyên đánh giá hiệu suất chiến lược và điều chỉnh kịp thời
Hướng tối ưu hóa chiến lược
- Tiến hành cơ chế tham số thích ứng, điều chỉnh tham số chỉ số theo động thái biến động của thị trường
- Thêm chỉ số giao dịch để xác nhận phụ
- Tối ưu hóa quản lý kho, xem xét việc xây dựng và giảm kho theo lô
- Thêm mô-đun nhận diện môi trường thị trường, sử dụng chiến lược khác nhau trong các tình huống khác nhau
- Giới thiệu các thuật toán học máy để tối ưu hóa logic tạo tín hiệu
Tóm tắt
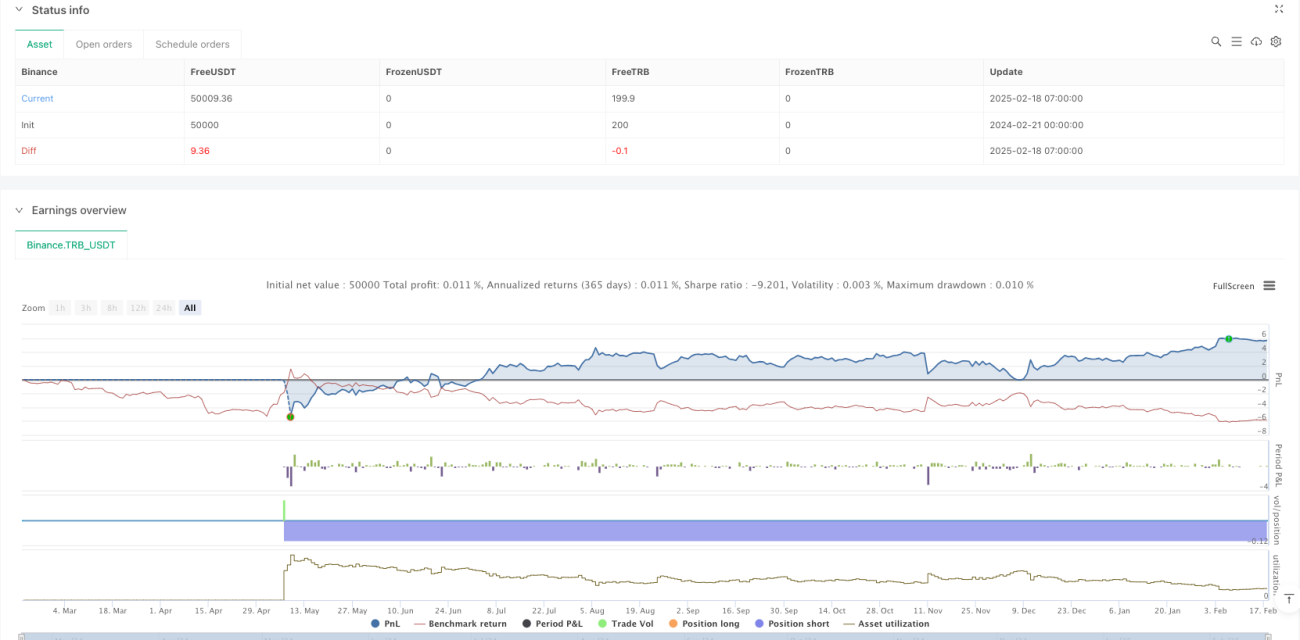
Chiến lược này tạo ra một hệ thống giao dịch theo dõi xu hướng tương đối hoàn chỉnh thông qua việc sử dụng tổng hợp nhiều chỉ số kỹ thuật. Chiến lược có tín hiệu đáng tin cậy, rủi ro có thể kiểm soát được, nhưng vẫn cần phải tối ưu hóa các tham số và logic liên tục theo tình hình thị trường trong môi trường thực. Bằng cách cải tiến và hoàn thiện liên tục, chiến lược này có thể đạt được lợi nhuận ổn định trong các môi trường thị trường khác nhau.
- 1