Chiến lược giao dịch theo xu hướng động dựa trên nhiều giai đoạn thời gian, số mũ Hurst và sự thoái lui Fibonacci

HURST FIBONACCI RSI MTF RR SL TP ATR
Ngày tạo: 2025-02-20 16:59:37 sửa đổi lần cuối: 2025-02-20 16:59:37
sao chép: 2 Số nhấp chuột: 393
2
tập trung vào
319
Người theo dõi

Chiến lược giao dịch theo xu hướng động dựa trên nhiều giai đoạn thời gian, số mũ Hurst và sự thoái lui Fibonacci Chiến lược giao dịch theo xu hướng động dựa trên nhiều giai đoạn thời gian, số mũ Hurst và sự thoái lui Fibonacci

Tổng quan

Đây là một chiến lược giao dịch đa chu kỳ thời gian sáng tạo kết hợp chỉ số Hurst Exponent và mức thu hồi Fibonacci. Chiến lược này đánh giá đặc điểm xu hướng thị trường bằng cách tính toán chỉ số Hurst trong các chu kỳ thời gian khác nhau và kết hợp với mức giá Fibonacci để xác định các cơ hội giao dịch tiềm năng. Chiến lược này áp dụng khung quản lý rủi ro nghiêm ngặt, bao gồm tỷ lệ rủi ro cố định, tỷ lệ lợi nhuận mục tiêu và giới hạn tần suất giao dịch hàng ngày và tổng thể.

Nguyên tắc chiến lược

Chiến lược này dựa trên hai yếu tố chính:

  1. Đánh giá tính chất của xu hướng thị trường bằng cách tính toán chỉ số Herst cho giai đoạn hiện tại và cao hơn. Chỉ số Herst lớn hơn 0,5 cho thấy thị trường có xu hướng liên tục, nhỏ hơn 0,5 cho thấy thị trường có thể có tính chất hồi phục trung bình.
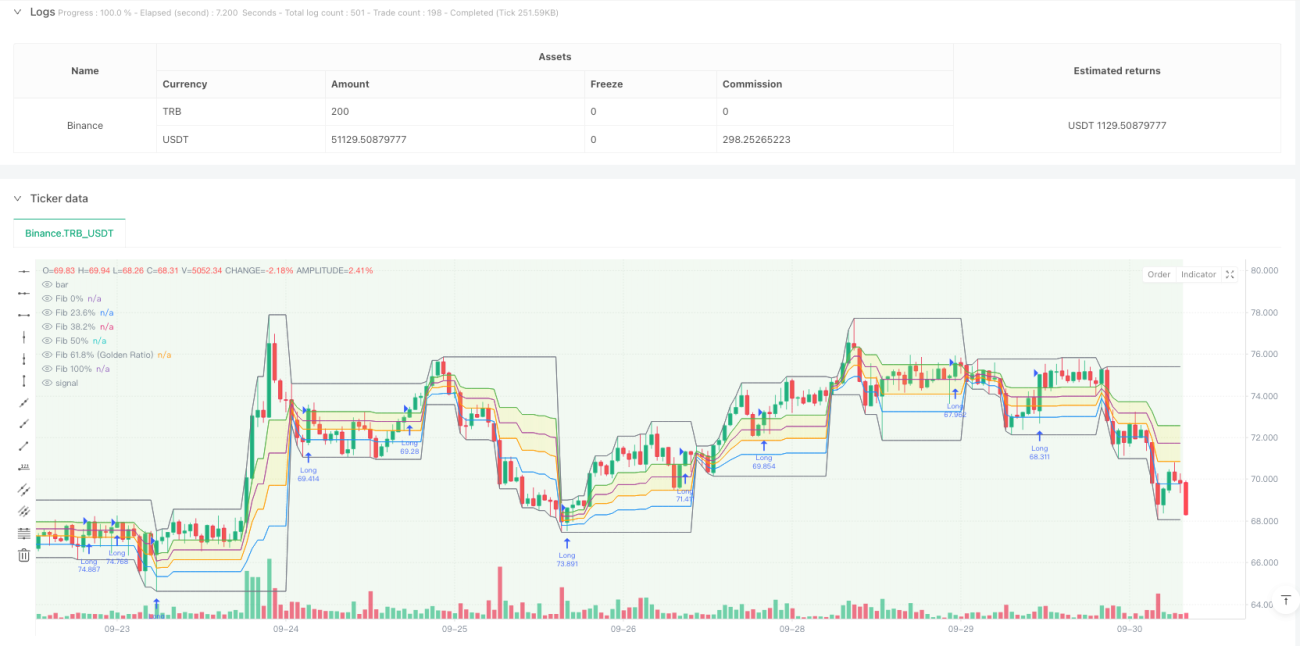
  2. Sử dụng mức Fibonacci Retracement quan trọng để tính toán mức cao và thấp hàng ngày, tập trung vào hai mức 61.8% ((Gold Split) và 38.2% . Đánh dấu nhiều khi chỉ số đường ngày lớn hơn 0.5 và giá vượt mức 61.8%; Đánh dấu trống khi chỉ số đường ngày nhỏ hơn 0.5 và giá giảm xuống mức 38.2% .

Lợi thế chiến lược

  1. Phân tích đa chiều: Cung cấp cái nhìn toàn diện hơn về thị trường bằng cách kết hợp phân tích xu hướng và mức giá trong các khoảng thời gian khác nhau
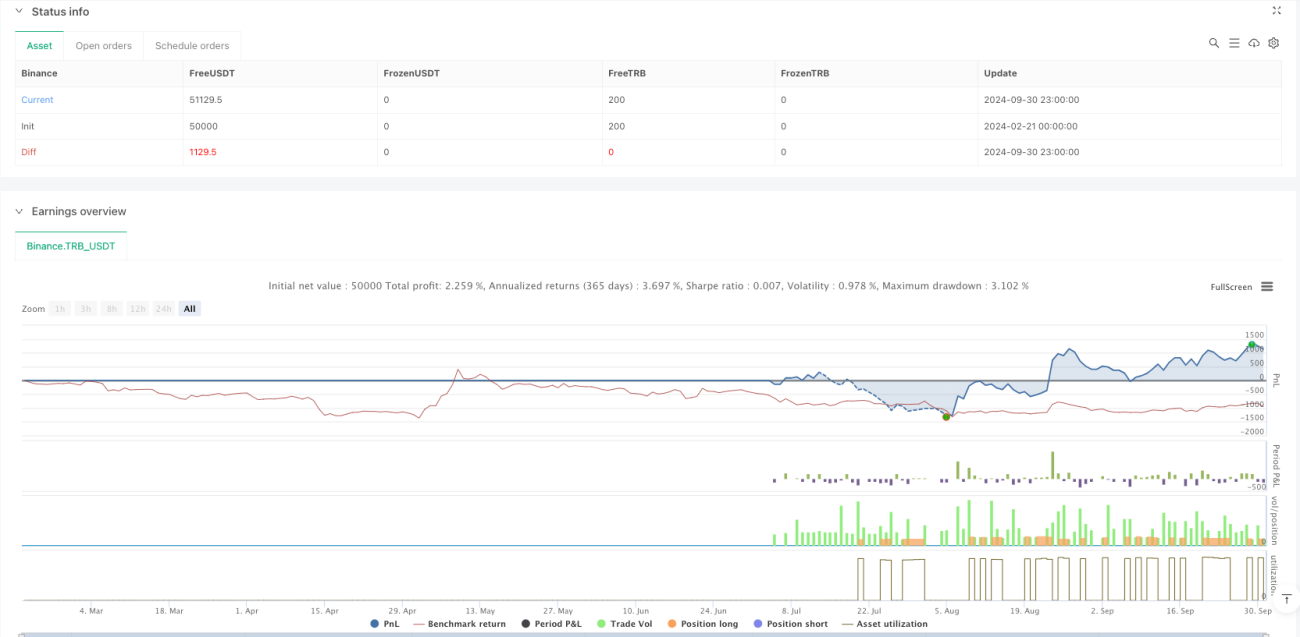
  2. Quản lý rủi ro tốt: Khung quản lý rủi ro với tỷ lệ rủi ro cố định (~ 2%) và tỷ lệ lợi nhuận mục tiêu (~ 1: 2)
  3. Kiểm soát tần số giao dịch: Thiết lập giới hạn số giao dịch tối đa và tổng số giao dịch mỗi ngày để tránh giao dịch quá mức
  4. Hỗ trợ hình ảnh: cung cấp bảng thông tin về xu hướng thị trường theo thời gian thực, thay đổi màu nền và các chỉ số quan trọng

Rủi ro chiến lược

  1. Tùy thuộc vào môi trường thị trường: có thể hoạt động kém trong thị trường ngang không có xu hướng rõ ràng
  2. Tính nhạy đối số: Lựa chọn chu kỳ tính toán chỉ số Herst và chu kỳ thời gian Fibonacci ảnh hưởng đến hiệu suất của chiến lược
  3. Tác động trượt: Có thể có rủi ro trượt lớn hơn trong điều kiện thị trường ít thanh khoản
  4. Hệ thống phức tạp: Sự kết hợp nhiều thành phần làm tăng khả năng thất bại của chiến lược

Hướng tối ưu hóa chiến lược

  1. Điều chỉnh tham số động: có thể tự động điều chỉnh chu kỳ tính toán của chỉ số Hurst theo biến động của thị trường
  2. Thêm bộ lọc: giới thiệu bộ lọc trạng thái thị trường bổ sung để cải thiện chất lượng tín hiệu
  3. Tối ưu hóa quản lý vị trí: Thực hiện quản lý vị trí động dựa trên tỷ lệ biến động
  4. Cải thiện cơ chế ra sân: Phát triển cách đặt mục tiêu lợi nhuận linh hoạt hơn

Tóm tắt

Đây là một chiến lược sáng tạo kết hợp các công cụ phân tích kỹ thuật cổ điển với các phương pháp định lượng hiện đại. Bằng cách phân tích nhiều chu kỳ thời gian và quản lý rủi ro nghiêm ngặt, chiến lược vẫn giữ được nền tảng lý thuyết và tập trung vào khả năng thực tế. Mặc dù có một số không gian tối ưu hóa, khung tổng thể có khả năng mở rộng tốt và giá trị thực tế.

Mã nguồn chiến lược
/*backtest
start: 2024-02-21 00:00:00
end: 2024-10-01 00:00:00
period: 1h
basePeriod: 1h
exchanges: [{"eid":"Binance","currency":"TRB_USDT"}]
*/

//@version=5
// Advanced Multi-Timeframe Trading System (Risk Managed)
// 
// Description:
// This strategy combines an approximate measure of market trending via a Hurst exponent
// calculation with Fibonacci retracement levels derived from a higher timeframe (default: Daily)
// to identify potential reversal zones and trade opportunities. The Hurst exponent is calculated
// as a rough indicator of market persistence, while the Fibonacci retracement levels provide potential
// support and resistance areas.
// 
// Signal Logic:
// - A long entry is signaled when the price crosses above the 61.8% Fibonacci level (Golden Ratio)
//   and the daily Hurst exponent is above 0.5 (suggesting a trending market).
// - A short entry is signaled when the price crosses below the 38.2% Fibonacci level and the daily Hurst
//   exponent is below 0.5.
// 
// Risk Management:
// Each trade is risk-managed with a stop-loss set at 2% below (or above for shorts) the entry price,
// and a take profit order is set to achieve a 1:2 risk-reward ratio. Position sizing is fixed at 10% of
// equity per trade. Additionally, the strategy limits trading to a maximum of 5 trades per day and 510 trades
// overall (for backtesting since 2019) to ensure a realistic number of orders.
// 
// Backtesting Parameters:
// - Initial Capital: $10,000
// - Commission: 0.1% per trade
// - Slippage: 1 tick per bar
// - Position Sizing: 10% of equity per trade
// 
// Disclaimer:
// Past performance is not indicative of future results. This strategy is experimental and is provided solely
// for educational purposes. Use caution and perform your own testing before any live deployment.
// 
// Author: [Your Name]
// Date: [Date]

strategy("Advanced Multi-Timeframe Trading System (Risk Managed)",
     overlay=true, 
     max_bars_back=500, 
     initial_capital=10000, 
     default_qty_type=strategy.percent_of_equity, 
     default_qty_value=10,          // 10% of equity per trade
     commission_type=strategy.commission.percent, 
     commission_value=0.1,          // 0.1% commission per trade
     slippage=1,                    // 1 tick per bar
     calc_on_order_fills=true, 
     calc_on_every_tick=true)

// ─── INPUTS ─────────────────────────────────────────────────────────────
hurstLen        = input.int(50, title="Hurst Lookback Period", minval=10)
fibTF           = input.timeframe("D", title="Fibonacci Retracement Timeframe")
maxTradesPerDay = input.int(5, title="Max Trades Per Day", minval=1)
maxTotalTrades  = input.int(510, title="Max Total Trades since 2019", minval=1)
riskPerc        = input.float(2.0, title="Risk Percent per Trade (%)", step=0.1) * 0.01  // 2% risk per trade
rrRatio         = input.float(2.0, title="Risk-Reward Ratio", step=0.1)                 // Target profit = 2x risk

// ─── FUNCTION: Approximate Hurst Exponent Calculation ──────────────────────
// This function uses a simple rescaled range method to approximate the Hurst exponent.
// Note: This is an experimental calculation and should be interpreted as a rough gauge of market trending.
calcHurst(src, len) =>
    mean   = ta.sma(src, len)
    dev    = src - mean
    cumDev = 0.0
    for i = 0 to len - 1
        cumDev := cumDev + dev[i]
    R     = ta.highest(cumDev, len) - ta.lowest(cumDev, len)
    S     = ta.stdev(src, len)
    hurst = na(S) or S == 0 ? na : math.log(R / S) / math.log(len)
    hurst

// Calculate the Hurst exponent on the current timeframe and from a higher timeframe (daily)
currHurst  = calcHurst(close, hurstLen)
dailyHurst = request.security(syminfo.tickerid, "D", calcHurst(close, hurstLen))

// ─── FIBONACCI RETRACEMENT LEVELS (WITH GOLDEN RATIO) ──────────────────────────
// Retrieve the daily high/low from the selected timeframe (default: Daily)
dHigh   = request.security(syminfo.tickerid, fibTF, high)
dLow    = request.security(syminfo.tickerid, fibTF, low)

// Define Fibonacci levels between the daily low and high.
fib_0   = dLow
fib_100 = dHigh
fib_236 = dLow + 0.236 * (dHigh - dLow)
fib_382 = dLow + 0.382 * (dHigh - dLow)
fib_500 = dLow + 0.5   * (dHigh - dLow)
fib_618 = dLow + 0.618 * (dHigh - dLow)  // Golden ratio level

// Plot the Fibonacci levels for reference.
pFib0   = plot(fib_0,   color=color.gray,   title="Fib 0%")
pFib236 = plot(fib_236, color=color.blue,   title="Fib 23.6%")
pFib382 = plot(fib_382, color=color.orange, title="Fib 38.2%")
pFib500 = plot(fib_500, color=color.purple, title="Fib 50%")
pFib618 = plot(fib_618, color=color.green,  title="Fib 61.8% (Golden Ratio)")
pFib100 = plot(fib_100, color=color.gray,   title="Fib 100%")
// Fill the area between the 61.8% and 38.2% levels to highlight the key retracement zone.
fill(pFib618, pFib382, color=color.new(color.yellow, 80), title="Fibonacci Retracement Zone")

// ─── TRADE COUNT MANAGEMENT ─────────────────────────────────────────────────
// To simulate realistic trading frequency, the strategy limits trades to a maximum of 5 per day and 510 overall.
var int tradesToday     = 0
var int globalTradeCount = 0

// Reset the daily trade counter at the start of a new day.
newDay = ta.change(time("D"))
if newDay
    tradesToday := 0

// Allow new trades only if within the daily and overall trade limits.
canTrade = (tradesToday < maxTradesPerDay) and (globalTradeCount < maxTotalTrades)

// ─── TRADING SIGNALS ─────────────────────────────────────────────────────────
// Entry conditions based on Fibonacci levels and daily Hurst conditions:
// • Long: Price crosses above the 61.8% (Golden Ratio) level and daily Hurst > 0.5.
// • Short: Price crosses below the 38.2% level and daily Hurst < 0.5.
longCond  = ta.crossover(close, fib_618) and (dailyHurst > 0.5)
shortCond = ta.crossunder(close, fib_382) and (dailyHurst < 0.5)

if longCond and canTrade
    strategy.entry("Long", strategy.long)
    tradesToday      := tradesToday + 1
    globalTradeCount := globalTradeCount + 1

if shortCond and canTrade
    strategy.entry("Short", strategy.short)
    tradesToday      := tradesToday + 1
    globalTradeCount := globalTradeCount + 1

// ─── RISK MANAGEMENT: STOP-LOSS & TAKE-PROFIT ──────────────────────────────
// For active positions, define stop-loss and take profit levels based on the entry price.
// This ensures that each trade risks approximately 2% of the entry price with a target
// of 2x the risk (1:2 risk-reward ratio).
if strategy.position_size > 0
    longStop   = strategy.position_avg_price * (1 - riskPerc)
    longTarget = strategy.position_avg_price * (1 + rrRatio * riskPerc)
    strategy.exit("Long Exit", from_entry="Long", stop=longStop, limit=longTarget)
if strategy.position_size < 0
    shortStop   = strategy.position_avg_price * (1 + riskPerc)
    shortTarget = strategy.position_avg_price * (1 - rrRatio * riskPerc)
    strategy.exit("Short Exit", from_entry="Short", stop=shortStop, limit=shortTarget)

// ─── CHART OVERLAYS & VISUAL AIDS ────────────────────────────────────────────
// Background color indicates the daily market trend:
// Green for trending conditions (dailyHurst > 0.5) and red for less trending conditions.
bgcolor(dailyHurst > 0.5 ? color.new(color.green, 90) : color.new(color.red, 90), title="Daily Trend Background")

// Display an information table in the top-right corner to help interpret key values.
var table infoTable = table.new(position.top_right, 2, 4, border_width=1, frame_color=color.gray)
if barstate.islast
    table.cell(infoTable, 0, 0, "Current Hurst", text_color=color.white, bgcolor=color.black)
    table.cell(infoTable, 1, 0, str.tostring(currHurst, "#.###"), text_color=color.white, bgcolor=color.black)
    table.cell(infoTable, 0, 1, "Daily Hurst", text_color=color.white, bgcolor=color.black)
    table.cell(infoTable, 1, 1, str.tostring(dailyHurst, "#.###"), text_color=color.white, bgcolor=color.black)
    table.cell(infoTable, 0, 2, "Trades Today", text_color=color.white, bgcolor=color.black)
    table.cell(infoTable, 1, 2, str.tostring(tradesToday), text_color=color.white, bgcolor=color.black)
    table.cell(infoTable, 0, 3, "Global Trades", text_color=color.white, bgcolor=color.black)
    table.cell(infoTable, 1, 3, str.tostring(globalTradeCount), text_color=color.white, bgcolor=color.black)

// Optional: Add labels on the final bar to mark the key Fibonacci levels.
if barstate.islast
    label.new(bar_index, fib_618, "61.8% (Golden Ratio)", style=label.style_label_left, color=color.green, textcolor=color.white, size=size.tiny)
    label.new(bar_index, fib_382, "38.2%", style=label.style_label_left, color=color.orange, textcolor=color.white, size=size.tiny)