
2
Follow
478
Followers
Tổng quan
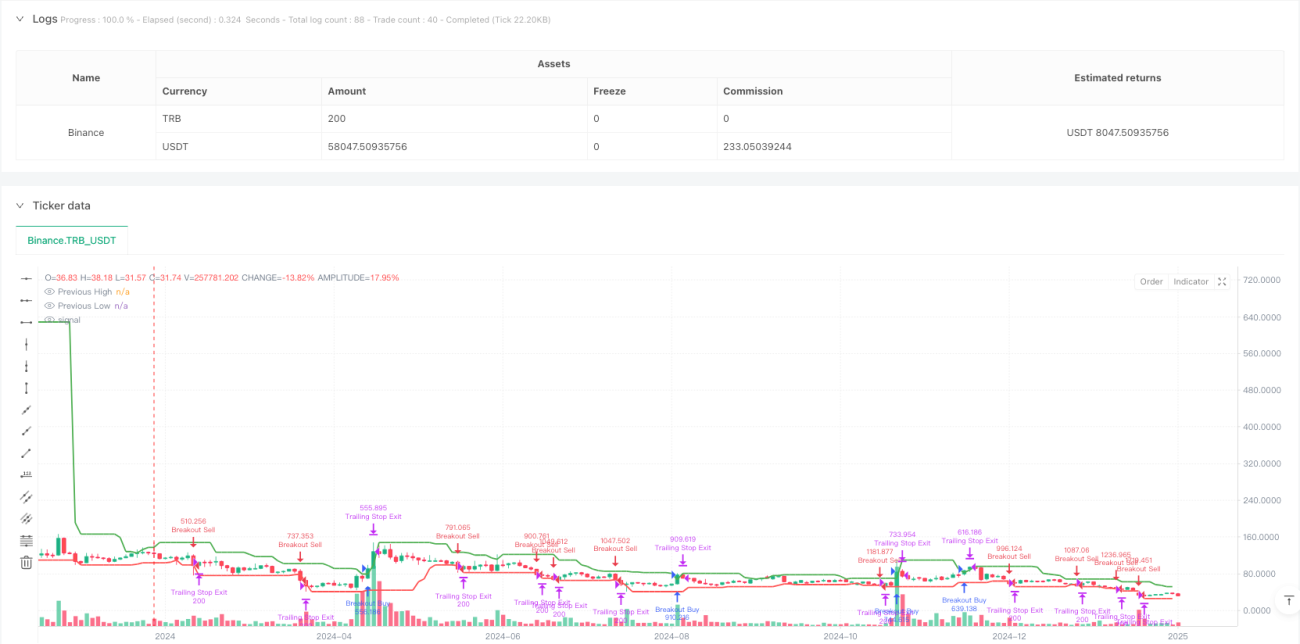
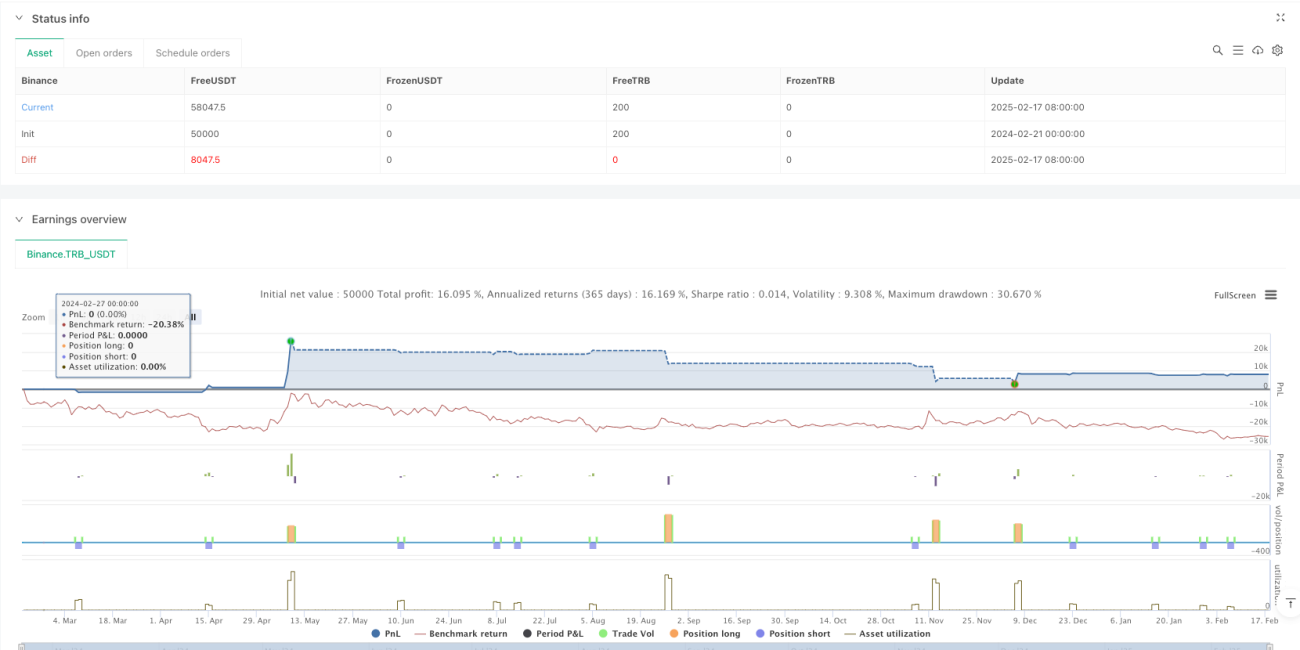
Chiến lược này là một hệ thống giao dịch dựa trên phá vỡ giá và theo dõi động dừng lỗ. Nó giao dịch bằng cách theo dõi giá cao nhất và thấp nhất trong N chu kỳ qua, giao dịch khi giá vượt qua các mức quan trọng này. Chiến lược sử dụng cơ chế dừng lỗ thông minh, chỉ kích hoạt dừng theo dõi khi đạt được 1% lợi nhuận, để lợi nhuận phát triển đầy đủ.
Nguyên tắc chiến lược
Logic cốt lõi của chiến lược bao gồm những phần chính sau:
- Tín hiệu đầu vào: Bằng cách tính toán giá cao nhất và giá thấp nhất trong N chu kỳ trước đó, nó sẽ kích hoạt tín hiệu giao dịch khi giá hiện tại vượt qua các mức này. Nhiều đầu vào yêu cầu giá vượt qua mức cao nhất định của giai đoạn trước, trong khi đầu trống cần phá vỡ mức thấp của giai đoạn trước.
- Quản lý giao dịch: Thực hiện thời gian làm mát giao dịch trong 1 giờ, tránh giao dịch thường xuyên khi có biến động mạnh.
- Kiểm soát rủi ro: Sử dụng lệnh dừng theo dõi động, chỉ được kích hoạt sau khi thu được 1% lợi nhuận, có thể bảo vệ lợi nhuận tốt hơn.
- Tối ưu hóa tham số: Các tham số quan trọng như chu kỳ xem lại, phá vỡ ngưỡng, tỷ lệ dừng lỗ, v.v. có thể được điều chỉnh theo các tình huống thị trường khác nhau.
Lợi thế chiến lược
- Quản lý rủi ro năng động: Bằng cách theo dõi các cơ chế dừng lỗ, chiến lược có thể giúp lợi nhuận tăng lên liên tục trong khi bảo vệ lợi nhuận.
- Khả năng thích ứng linh hoạt: Chiến lược có thể thích ứng với các điều kiện thị trường khác nhau để tối ưu hóa hiệu suất bằng cách điều chỉnh các tham số.
- Cơ chế lọc: Sử dụng thời gian làm mát giao dịch để tránh giao dịch quá mức và cải thiện chất lượng giao dịch.
- Đơn giản và hiệu quả: Chiến lược logic rõ ràng, dễ hiểu và dễ thực hiện, trong khi vẫn có khả năng mở rộng tốt.
Rủi ro chiến lược
- Rủi ro phá vỡ giả: Thị trường có thể bị phá vỡ giả, dẫn đến tín hiệu sai.
- Tác động điểm trượt: Trong thời gian có biến động cao, có thể có điểm trượt lớn hơn, ảnh hưởng đến hiệu suất chiến lược.
- Nhận thức tham số: Hiệu suất của chiến lược nhạy cảm với các thiết lập tham số, cần tối ưu hóa cẩn thận.
- Tùy thuộc vào môi trường thị trường: có thể không hoạt động tốt trong môi trường biến động thấp.
Hướng tối ưu hóa chiến lược
- Tiến hành chỉ số giao dịch: tăng độ tin cậy của tín hiệu đột phá bằng cách xác nhận giao dịch.
- Thêm bộ lọc xu hướng: kết hợp với các chỉ số xu hướng dài hạn, chỉ giao dịch theo hướng xu hướng.
- Điều chỉnh tham số động: Điều chỉnh tự động các tham số phá vỡ và dừng lỗ theo biến động của thị trường.
- Nhiều chu kỳ thời gian: tích hợp các tín hiệu từ nhiều chu kỳ thời gian để cải thiện độ chính xác.
Tóm tắt
Đây là một chiến lược theo dõi xu hướng được thiết kế hợp lý, kết hợp với phá vỡ giá và dừng động, có thể nắm bắt xu hướng lớn và kiểm soát rủi ro một cách hiệu quả. Chiến lược có khả năng tùy biến mạnh mẽ, có thể thích ứng với các môi trường thị trường khác nhau thông qua tối ưu hóa tham số.
Source
Pine
Strategy parameters
Related strategies
Comment
All comments (0)
No data
- 1