Chiến lược theo dõi xu hướng đa chỉ báo kết hợp với lệnh dừng lỗ và dừng lãi động ATR

Tổng quan
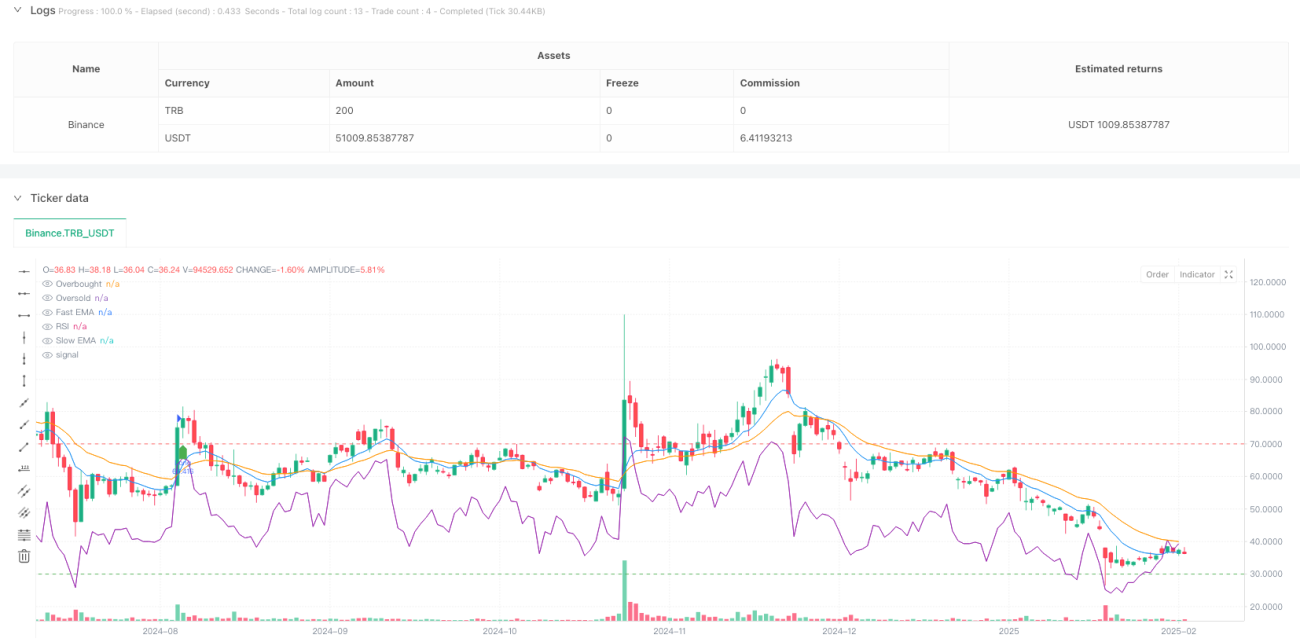
Chiến lược này là một hệ thống giao dịch theo dõi xu hướng dựa trên nhiều chỉ số kỹ thuật. Nó kết hợp đường trung bình (EMA), chỉ số tương đối mạnh (RSI), khối lượng giao dịch (Volume) và chỉ số sóng thực (ATR) để xác định thời gian vào và sử dụng ATR để thiết lập các vị trí dừng và dừng động.
Nguyên tắc chiến lược
Chiến lược sử dụng giao thoa của EMA (9 chu kỳ) và EMA (21 chu kỳ) để nắm bắt sự thay đổi của xu hướng. Dựa trên đó, kết hợp với chỉ số RSI (14 chu kỳ) để lọc các khu vực quá mua và bán, yêu cầu các giá trị RSI nằm ngoài vùng quá mua (70) và quá bán (30). Trong khi đó, chiến lược yêu cầu giao dịch lớn hơn đường trung bình giao dịch 20 chu kỳ và yêu cầu giá mua bán phá vỡ một đường K trước để xác nhận thêm.
Lợi thế chiến lược
- Việc sử dụng tổng hợp các chỉ số kỹ thuật đa dạng giúp tăng độ tin cậy của tín hiệu giao dịch
- Cài đặt dừng lỗ động để thích ứng với sự biến động của thị trường
- Theo dõi hệ thống ngăn chặn thiệt hại bảo vệ lợi nhuận đã đạt được
- Cơ chế xác nhận giao dịch giảm đột phá giả mạo
- Xác nhận đột phá đường K giúp tăng độ chính xác giao dịch
- Các tham số chiến lược có thể được điều chỉnh linh hoạt theo các đặc điểm thị trường khác nhau
Rủi ro chiến lược
- Nhiều chỉ số có thể làm mất đi một số cơ hội giao dịch
- Các tín hiệu sai có thể xảy ra thường xuyên trong thị trường giao dịch ngang
- Sự biến động nhanh chóng và mạnh mẽ có thể dẫn đến vị trí dừng không phù hợp
- Một đợt nhảy vọt lớn có thể phá vỡ điểm dừng gây ra tổn thất vượt mức dự kiến
Các biện pháp sau đây được đề xuất để quản lý rủi ro:
- Thường xuyên tối ưu hóa các tham số chỉ số để thích ứng với sự thay đổi của thị trường
- Bộ lọc giao dịch kết hợp với chuyển động chu kỳ thời gian lớn hơn
- Thiết lập giới hạn giao dịch tối đa mỗi ngày
- Thực hiện kế hoạch quản lý tài chính hợp lý
Hướng tối ưu hóa chiến lược
-
Ghi tham số cho chỉ số tự điều chỉnh:
Có thể tự động điều chỉnh thiết lập chu kỳ của EMA và RSI theo biến động của thị trường, giúp chiến lược thích ứng tốt hơn với các môi trường thị trường khác nhau. -
Thêm bộ lọc môi trường thị trường:
Thêm chỉ số cường độ xu hướng như ADX, tự động giảm vị trí hoặc tạm dừng giao dịch trên thị trường ngang. -
Tối ưu hóa phương án dừng lỗ:
Có thể cân nhắc việc thiết lập dừng lỗ kết hợp với vị trí kháng cự hỗ trợ để tăng hiệu quả của dừng lỗ. -
Quản lý khối lượng giao dịch:
Điều chỉnh quy mô nắm giữ tùy theo biến động của thị trường và tính thanh khoản.
Tóm tắt
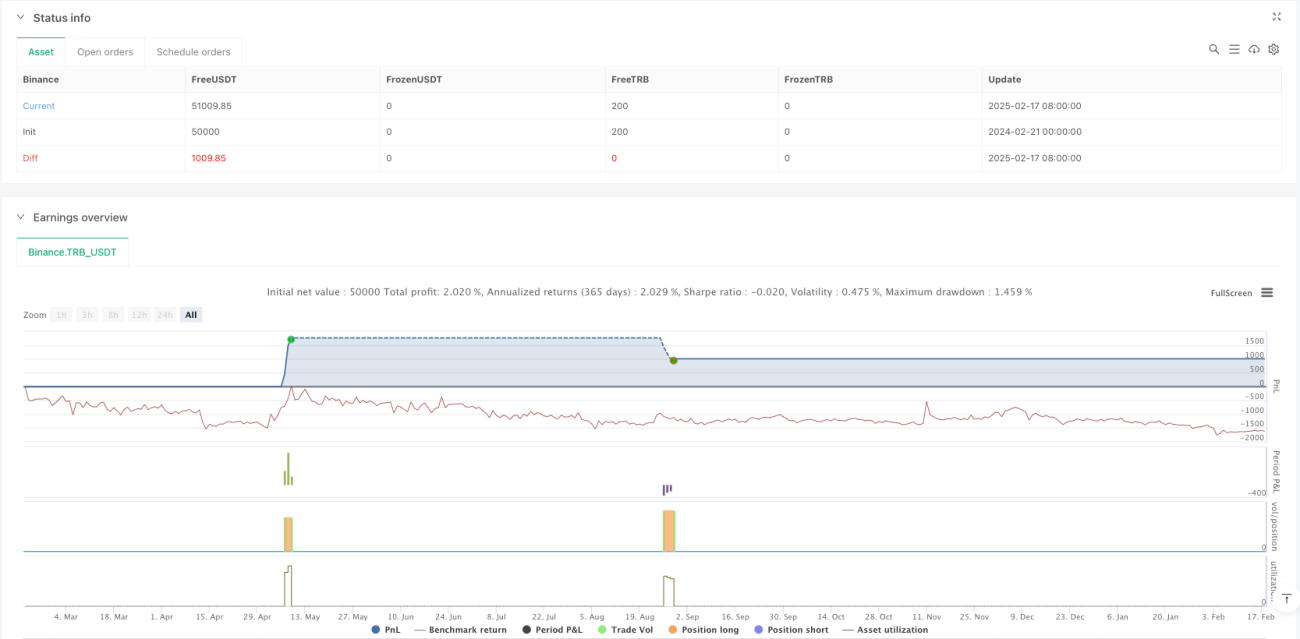
Đây là một chiến lược theo dõi xu hướng có cấu trúc, logic nghiêm ngặt. Bằng cách sử dụng nhiều chỉ số kỹ thuật, nó đảm bảo độ tin cậy của tín hiệu giao dịch và có thể kiểm soát rủi ro hiệu quả. Các thiết lập dừng lỗ động cung cấp tỷ lệ lợi nhuận tốt hơn so với rủi ro.
/*backtest
start: 2024-02-21 00:00:00
end: 2025-02-18 08:00:00
period: 1d
basePeriod: 1d
exchanges: [{"eid":"Binance","currency":"TRB_USDT"}]
*/

//@version=6
strategy("15m EMA RSI Strategy with ATR SL/TP and Candle Break Confirmation", overlay=true, initial_capital=100000, default_qty_type=strategy.percent_of_equity, default_qty_value=10)

// INPUTS- 1