Chiến lược giao dịch xu hướng chu kỳ chéo Bitcoin dựa trên sức mạnh tiềm năng động của EMA đa cấp và RSI

2
Follow
478
Followers
Tổng quan
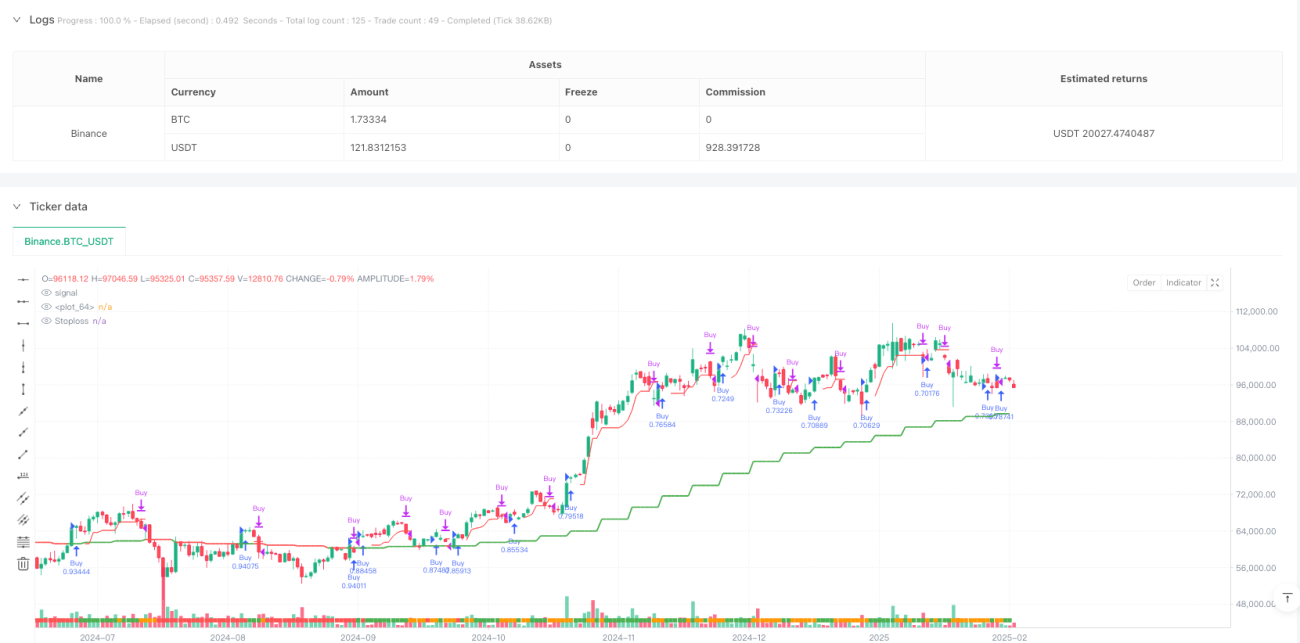
Chiến lược này là một hệ thống giao dịch theo dõi xu hướng dựa trên phân tích xuyên chu kỳ, kết hợp đường trung bình EMA ở cấp đường tuần và ngày và chỉ số RSI để xác định xu hướng và động lực của thị trường. Chiến lược xác định cơ hội giao dịch thông qua sự nhất quán xu hướng trên nhiều khung thời gian và sử dụng dừng động dựa trên ATR để quản lý rủi ro.
Nguyên tắc chiến lược
Logic cốt lõi của chiến lược này dựa trên các yếu tố chính sau:
- Sử dụng EMA ở mức đường tuần hoàn làm bộ lọc xu hướng chính, kết hợp giá đóng cửa đường ngày với mối quan hệ của EMA đường tuần hoàn để xác định tình trạng thị trường
- Thấp điểm được xác định bởi xu hướng điều chỉnh động của chỉ số ATR, tăng khả năng thích ứng của chiến lược
- Tích hợp RSI như một điều kiện lọc giao dịch bổ sung
- Sử dụng hệ thống dừng lỗ theo dõi dựa trên giá tối thiểu 7 ngày và ATR
- Khi có tín hiệu cảnh báo tăng quá mức, chiến lược sẽ tạm dừng mở vị trí để tránh rủi ro
Lợi thế chiến lược
- Phân tích nhiều khung thời gian cung cấp một cái nhìn toàn diện hơn về thị trường, có thể lọc hiệu quả các đột phá giả mạo
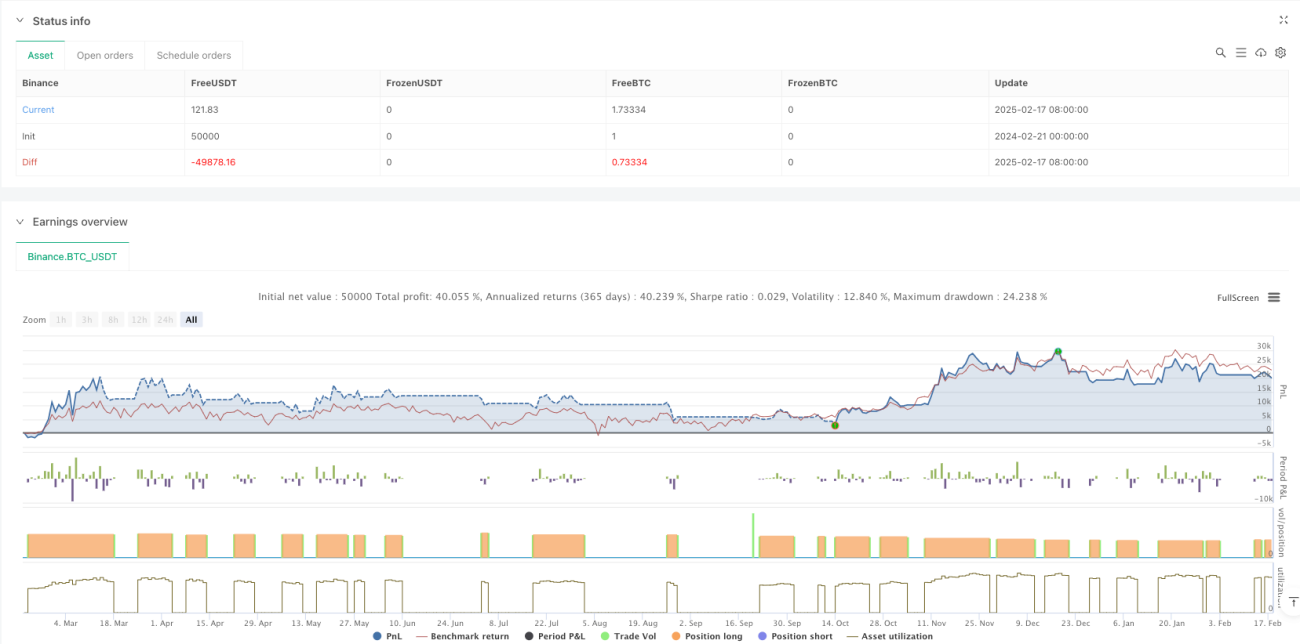
- Cơ chế dừng động tự điều chỉnh theo biến động của thị trường, cung cấp kiểm soát rủi ro linh hoạt
- Bộ lọc động lực RSI giúp xác nhận cường độ xu hướng và cải thiện chất lượng nhập cảnh
- Hệ thống bao gồm các cơ chế cảnh báo trước khi nghiện quá mức, giúp tránh rủi ro rút lui
- Các tham số của chiến lược có thể điều chỉnh để tối ưu hóa phù hợp với các môi trường thị trường khác nhau
Rủi ro chiến lược
- Có thể có nhiều giao dịch trong thị trường ngang dẫn đến tăng chi phí giao dịch
- Có rủi ro rút tiền lớn khi giao dịch với 100% vốn
- Tùy thuộc vào các chỉ số kỹ thuật có thể không phản ứng kịp thời khi xảy ra sự kiện bất ngờ trên thị trường
- Phân tích nhiều khung thời gian có thể có các tín hiệu mâu thuẫn ở nhiều cấp độ
- Tracking Stop có thể được kích hoạt quá sớm khi biến động mạnh
Hướng tối ưu hóa chiến lược
- Tiếp tục giới thiệu bộ lọc biến động để giảm tần suất giao dịch trong thời gian biến động thấp
- Thêm hệ thống quản lý vị trí, điều chỉnh tỷ lệ giữ vị trí theo tình trạng thị trường
- Kết hợp các chỉ số cơ bản để cung cấp thêm thông tin về môi trường thị trường
- Tối ưu hóa các tham số tracking stop loss để phù hợp hơn với các giai đoạn thị trường khác nhau
- Thêm phân tích khối lượng giao dịch để tăng độ chính xác trong việc đánh giá xu hướng
Tóm tắt
Đây là một chiến lược theo dõi xu hướng có cấu trúc và logic rõ ràng. Chiến lược có thể nắm bắt được xu hướng chính tốt hơn thông qua phân tích nhiều khung thời gian và lọc các chỉ số động. Mặc dù có một số rủi ro vốn có, chiến lược vẫn có nhiều chỗ cải thiện bằng cách tối ưu hóa tham số và thêm các chỉ số bổ sung.
Source
Pine
/*backtest
start: 2024-02-21 00:00:00
end: 2025-02-18 08:00:00
period: 1d
basePeriod: 1d
exchanges: [{"eid":"Binance","currency":"BTC_USDT"}]
*/

// @version=6
strategy("Bitcoin Regime Filter Strategy",         // Strategy name
     overlay=true,                                 // The strategy will be drawn directly on the price chart
initial_capital=10000, // Initial capital of 10000 USDStrategy parameters
Related strategies
Comment
All comments (0)
No data
- 1