Chiến lược hồi quy chéo RSI đa cấp

Tổng quan
Chiến lược này là một hệ thống giao dịch tự động dựa trên chỉ số tương đối mạnh (RSI), chủ yếu để nắm bắt các cơ hội hồi phục tiềm năng bằng cách xác định các điều kiện bán tháo thị trường. Chiến lược này sử dụng phương pháp tạo vị trí tiến bộ, xây dựng nhiều vị trí khi RSI vượt quá mức thấp và kiểm soát rủi ro bằng cách đặt mục tiêu lợi nhuận. Hệ thống được thiết kế với cơ chế quản lý tiền linh hoạt, sử dụng 6,6% tổng tài khoản cho mỗi giao dịch, cho phép tối đa 15 lần tăng vị trí theo kiểu kim tự tháp.
Nguyên tắc chiến lược
Logic cốt lõi của chiến lược này dựa trên các yếu tố chính sau:
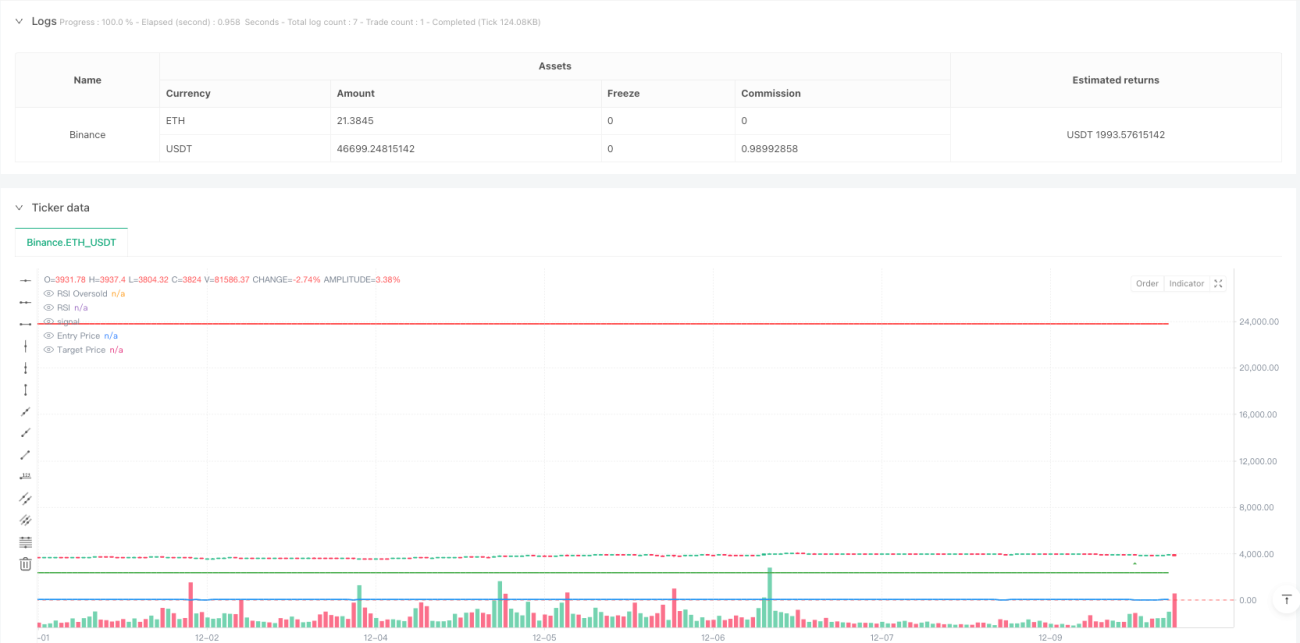
- Tín hiệu mua: Tín hiệu mua được kích hoạt khi mức bán vượt mức 28.5 dưới chỉ số RSI 14 chu kỳ
- Quản lý vị trí: 6.6% quyền lợi tài khoản sử dụng mỗi lần xây dựng nhà kho
- Tạo lợi nhuận: Giảm 50% cổ phần khi giá đạt mức tăng 900%
- Hiển thị: Ghi dấu các tín hiệu mua và bán, đường cong RSI, giá nhập và giá mục tiêu trên biểu đồ
Chiến lược để đánh giá xu hướng thị trường bằng cách quan sát hiệu suất của chỉ số RSI trong khu vực bán tháo, đặt hàng dần dần khi có tín hiệu bán tháo để giảm chi phí đặt hàng.
Lợi thế chiến lược
- Xây dựng vị trí có hệ thống: Tự động nhận diện cơ hội giao dịch thông qua các tham số RSI được đặt trước, tránh sự lệch lạc chủ quan do phán đoán nhân tạo
- Phân tán rủi ro: Sử dụng phương pháp xây dựng kho theo thứ tự, xây dựng nhiều vị trí ở các mức giá khác nhau, phân tán rủi ro hiệu quả
- Tính linh hoạt: Các tham số chiến lược có thể được điều chỉnh theo các điều kiện thị trường khác nhau và sở thích rủi ro cá nhân
- Bảo vệ lợi nhuận: Đặt mục tiêu lợi nhuận rõ ràng, tự động giảm bớt khi đạt được mục tiêu và khóa một phần lợi nhuận
- Hiệu quả tài chính: Tăng hiệu quả sử dụng tài chính thông qua kiểm soát vị thế hợp lý và cơ chế gia tăng
Rủi ro chiến lược
- Rủi ro xu hướng: có thể thường xuyên kích hoạt tín hiệu đặt vị trí trong xu hướng giảm mạnh, dẫn đến mất tiền
- Các tham số nhạy cảm: Các tham số RSI, tỷ lệ đặt vị trí và các thiết lập không phù hợp có thể ảnh hưởng đến hiệu suất của chiến lược
- Thị trường thanh khoản: Trong thị trường thiếu thanh khoản, giao dịch có thể khó hoàn thành theo giá mục tiêu
- Quản lý tài chính: Tiếp tục tăng cường rủi ro có thể dẫn đến lỗ hổng rủi ro quá lớn
Giải pháp:
- Tăng bộ lọc xu hướng, tạm dừng xây dựng kho trong xu hướng giảm rõ ràng
- Cài đặt tham số tối ưu hóa bằng cách đo ngược
- Thiết lập giới hạn rút tối đa
- Hoạt động điều chỉnh giảm giá
Hướng tối ưu hóa chiến lược
- Các tham số động: điều chỉnh tự động các tham số RSI và điều kiện đặt vị trí theo biến động của thị trường
- Cơ chế dừng lỗ: Tăng chức năng dừng lỗ di động, kiểm soát rủi ro tốt hơn
- Thị trường lọc: thêm các điều kiện lọc như khối lượng giao dịch, xu hướng, để cải thiện chất lượng tín hiệu
- Tối ưu hóa xuất phát: Thiết kế các cơ chế kết thúc lợi nhuận linh hoạt hơn, chẳng hạn như cắt giảm cổ phiếu theo giai đoạn
- Kiểm soát rủi ro: tăng giới hạn rút tối đa và kiểm soát lỗ hổng rủi ro
Tóm tắt
Chiến lược này xác định cơ hội bán tháo thông qua chỉ số RSI, kết hợp tăng cường theo kiểu kim tự tháp và tỷ lệ cố định để kiếm lợi nhuận, xây dựng một hệ thống giao dịch hoàn chỉnh. Ưu điểm của chiến lược là hoạt động có hệ thống và phân tán rủi ro, nhưng cần chú ý đến tác động của xu hướng thị trường và cài đặt tham số đối với hiệu suất chiến lược. Bằng cách thêm các biện pháp tối ưu hóa như điều chỉnh tham số động, cơ chế dừng lỗ và lọc thị trường, bạn có thể nâng cao hơn nữa sự ổn định và khả năng sinh lợi của chiến lược.
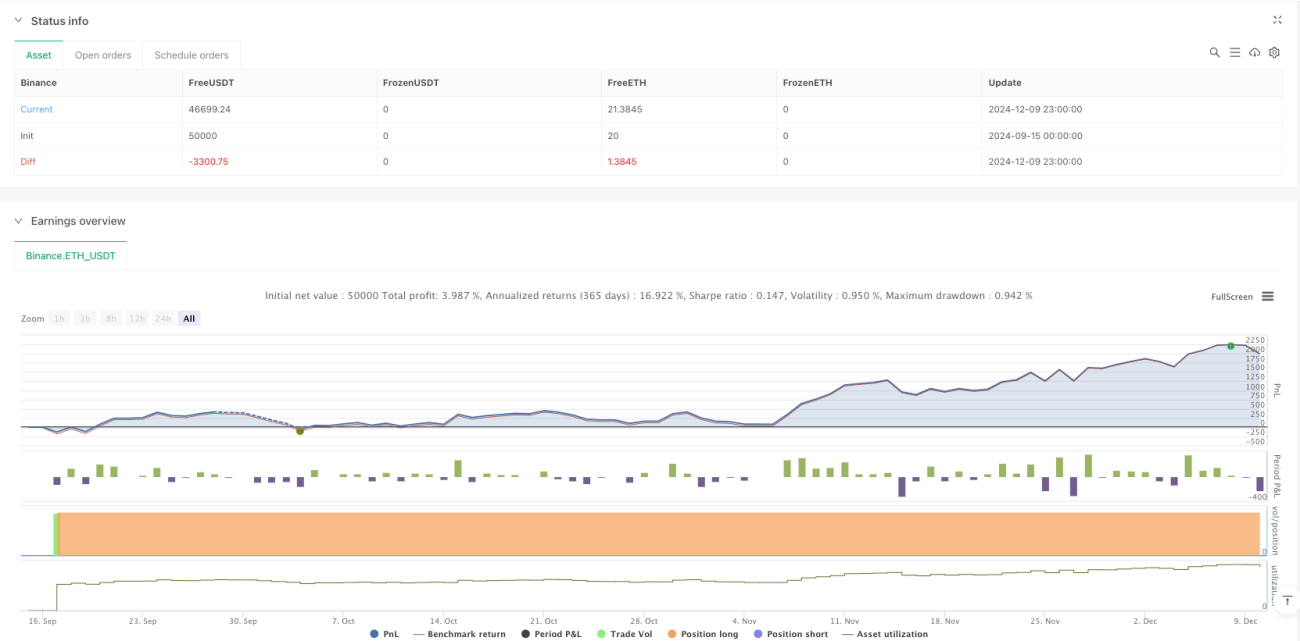
/*backtest
start: 2024-09-15 00:00:00
end: 2024-12-10 00:00:00
period: 1h
basePeriod: 1h
exchanges: [{"eid":"Binance","currency":"ETH_USDT"}]
*/

//@version=5
strategy("RSI Cross Under Strategy", overlay=true, initial_capital=1500, default_qty_type=strategy.percent_of_equity, default_qty_value=6.6)

// Input parameters- 1