Chiến lược động lượng xu hướng Triple EMA và Fisher Transform

Tổng quan
Chiến lược này kết hợp hai chỉ số kỹ thuật TEMA và Fisher Transform để xác định thời gian vào và ra thị trường bằng cách nhận ra xu hướng và tín hiệu động lực. TEMA là một chỉ số theo dõi xu hướng có độ trễ thấp, có thể xác định hiệu quả hướng của xu hướng thị trường, trong khi Fisher Transform cung cấp tín hiệu động lực rõ ràng hơn bằng cách chuyển đổi biến đổi giá thành phân bố chính xác Gaussian. Chiến lược sử dụng tín hiệu chéo làm điều kiện kích hoạt giao dịch, kết hợp lợi thế của theo dõi xu hướng và phân tích động lực.
Nguyên tắc chiến lược
Lập luận cốt lõi của chiến lược được xây dựng dựa trên hai chỉ số chính:
- Chỉ số TEMA sử dụng phương pháp tính toán trung bình di chuyển chỉ số ba, giảm độ trễ của trung bình di chuyển truyền thống bằng công thức "3 × EMA - 3 × EMA (((EMA) + EMA (((EMA)) ", với chu kỳ mặc định là 21 <unk>.
- Chỉ số Fisher Transform chuyển đổi dữ liệu giá thành phân phối chính xác, tham số mặc định là 10, và sử dụng biến đổi đối số sau khi xử lý tiêu chuẩn hóa giá điểm cao và thấp, làm cho tín hiệu rõ ràng hơn.
Các quy tắc giao dịch như sau:
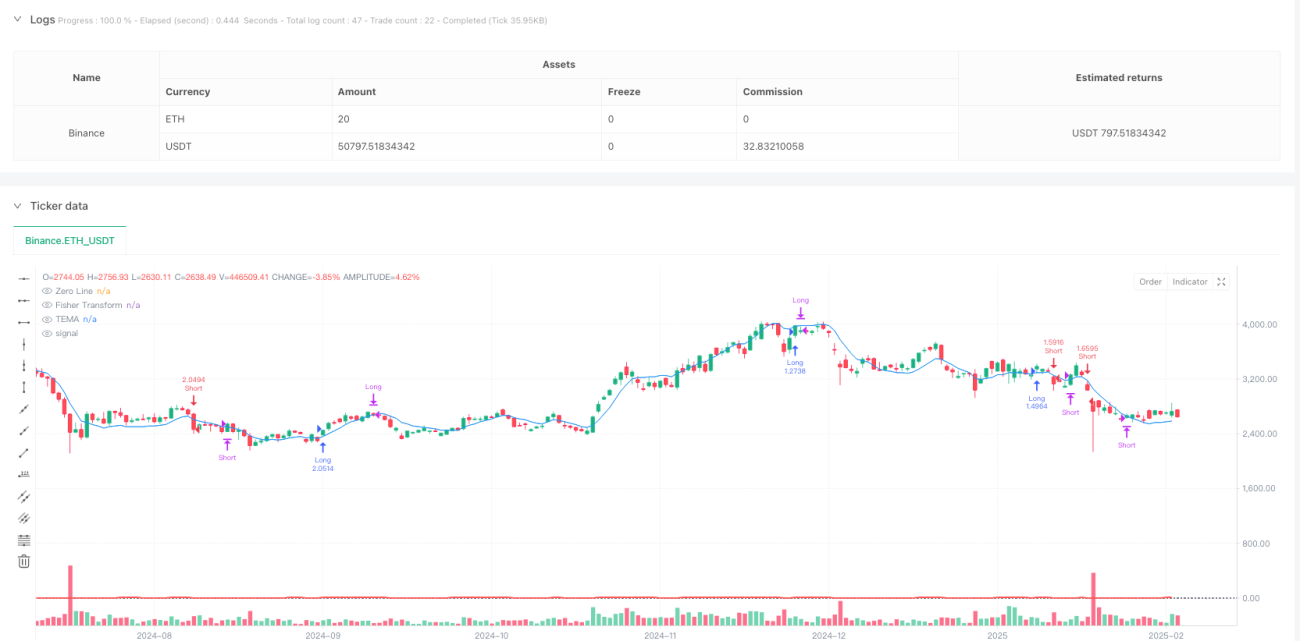
- Làm nhiều điều kiện: giá trên đường TEMA và trên trục 0 trên Fisher Transform
- Điều kiện làm trống: Giá vượt qua đường TEMA và vượt qua trục 0 dưới Fisher Transform
- Nhiều lần xuất hiện: Giá vượt qua đường TEMA hoặc Fisher Transform vượt qua 0 axis
- Thẻ rỗng xuất hiện: giá trên đường TEMA hoặc 0 trên Fisher Transform
Lợi thế chiến lược
- Tín hiệu đáng tin cậy cao: có thể lọc hiệu quả các tín hiệu giả mạo bằng cách kết hợp xu hướng và động lực
- Độ trễ thấp: TEMA có tốc độ phản hồi nhanh hơn so với trung bình di động truyền thống
- Tín hiệu rõ ràng: Tính phân bố chính xác của Fisher Transform giúp tín hiệu giao dịch rõ ràng hơn
- Kiểm soát rủi ro tốt hơn: thiết lập các điều kiện dừng lỗ rõ ràng
- Các tham số có thể điều chỉnh: Các tham số chỉ số có thể được điều chỉnh theo các điều kiện thị trường khác nhau
- Hiển thị tốt: cung cấp biểu đồ rõ ràng
Rủi ro chiến lược
- Rủi ro thị trường biến động: Tín hiệu đột phá sai thường xuyên có thể xảy ra trong thị trường đi ngang.
- Rủi ro về sự chậm trễ: Mặc dù TEMA đã giảm sự chậm trễ, nhưng vẫn có một mức độ chậm trễ
- Độ nhạy tham số: Các thiết lập tham số khác nhau có thể dẫn đến sự khác biệt lớn về hiệu suất chiến lược
- Thị trường phụ thuộc vào môi trường: chiến lược hoạt động tốt hơn trong thị trường có xu hướng rõ ràng
Hướng tối ưu hóa chiến lược
- Tiết xuất bộ lọc biến động: có thể thêm bộ lọc chỉ số ATR vào tín hiệu giao dịch trong môi trường biến động thấp
- Tối ưu hóa cơ chế ra sân: Có thể xem xét thêm các cơ chế dừng lỗ di động hoặc bảo vệ lợi nhuận
- Thêm bộ lọc thời gian: có thể điều chỉnh chiến lược giao dịch theo đặc điểm thị trường trong các khoảng thời gian khác nhau
- Thêm xác nhận khối lượng giao dịch: kết hợp các chỉ số khối lượng giao dịch để tăng độ tin cậy tín hiệu
- Tối ưu hóa tham số động: điều chỉnh tham số chỉ số động theo tình trạng thị trường
Tóm tắt
Đây là một chiến lược giao dịch hoàn chỉnh kết hợp xu hướng và phân tích động lực, sử dụng phối hợp TEMA và Fisher Transform, đảm bảo khả năng theo dõi xu hướng và cung cấp tín hiệu xác nhận động lực rõ ràng. Thiết kế chiến lược hợp lý, có tính thực tế tốt, nhưng trong ứng dụng thực tế cần chú ý đến sự thích nghi của môi trường thị trường và tối ưu hóa tham số theo tình huống cụ thể.
/*backtest
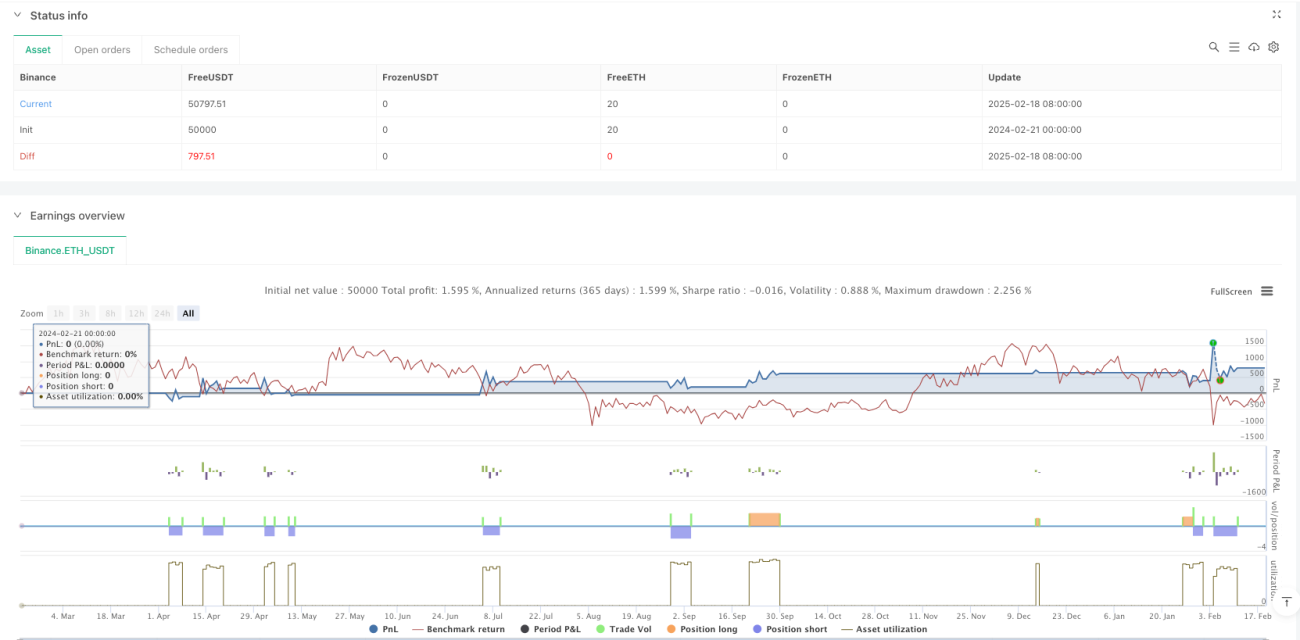
start: 2024-02-21 00:00:00
end: 2025-02-19 00:00:00
period: 1d
basePeriod: 1d
exchanges: [{"eid":"Binance","currency":"ETH_USDT"}]
*/
//@version=5
strategy("Triple EMA (TEMA) + Fisher Transform Strategy", overlay=true, default_qty_type=strategy.percent_of_equity, default_qty_value=10)
// ==== Triple EMA (TEMA) Settings ====- 1