
Tổng quan
Đây là một hệ thống giao dịch thông minh dựa trên tín hiệu chéo hai đường cong, kết hợp với chức năng quản lý rủi ro. Hệ thống sử dụng tín hiệu giao dịch ngắn hạn và trung bình di chuyển đơn giản dài hạn ((SMA) để tạo ra tín hiệu giao dịch, đồng thời tích hợp các chức năng dừng lỗ và dừng để kiểm soát rủi ro. Chiến lược này sử dụng phương pháp quản lý rủi ro phần trăm, điều chỉnh quy mô vị trí theo động lực của tài khoản tài chính, tự động hóa và thông minh hóa quá trình giao dịch.
Nguyên tắc chiến lược
Chiến lược này dựa trên những nguyên tắc cốt lõi sau:
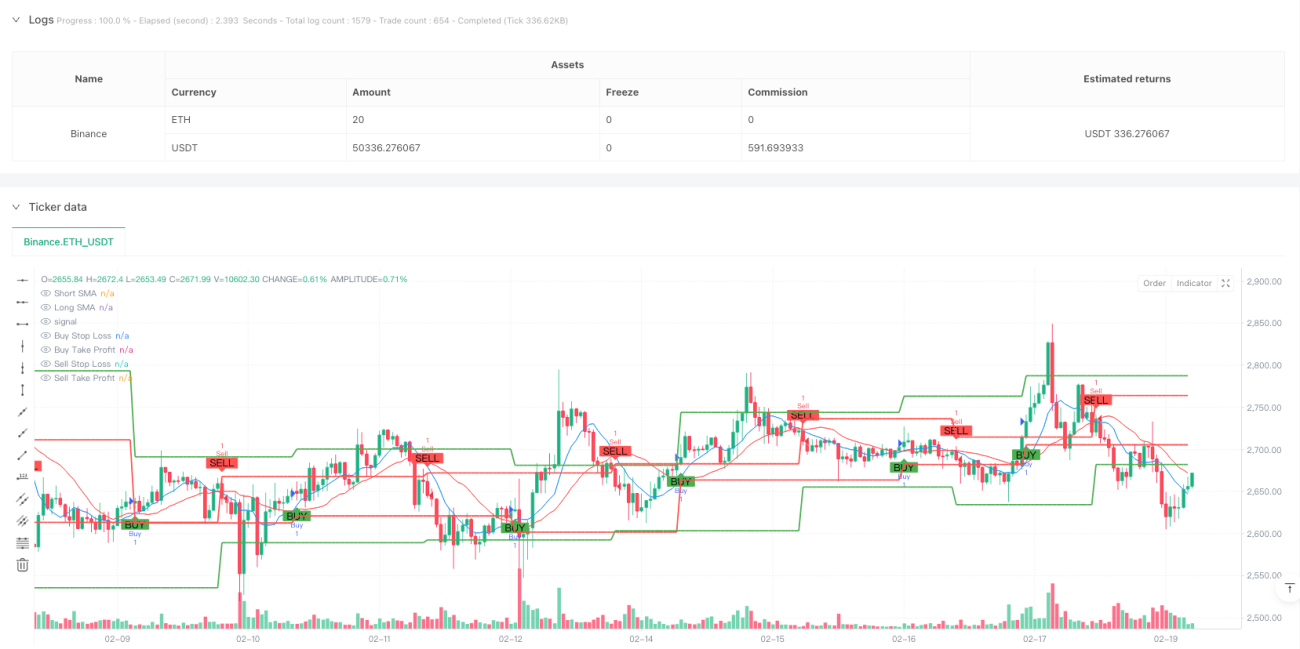
- Sử dụng giao thoa của hai đường trung bình di chuyển đơn giản (SMA) vào ngày 9 và 21 để nắm bắt xu hướng thị trường. Khi đường trung bình ngắn hạn đi lên vượt qua đường trung bình dài hạn, nó tạo ra tín hiệu đa; Khi đường trung bình ngắn hạn đi xuống vượt qua đường trung bình dài hạn, nó tạo ra tín hiệu ngắn hạn.
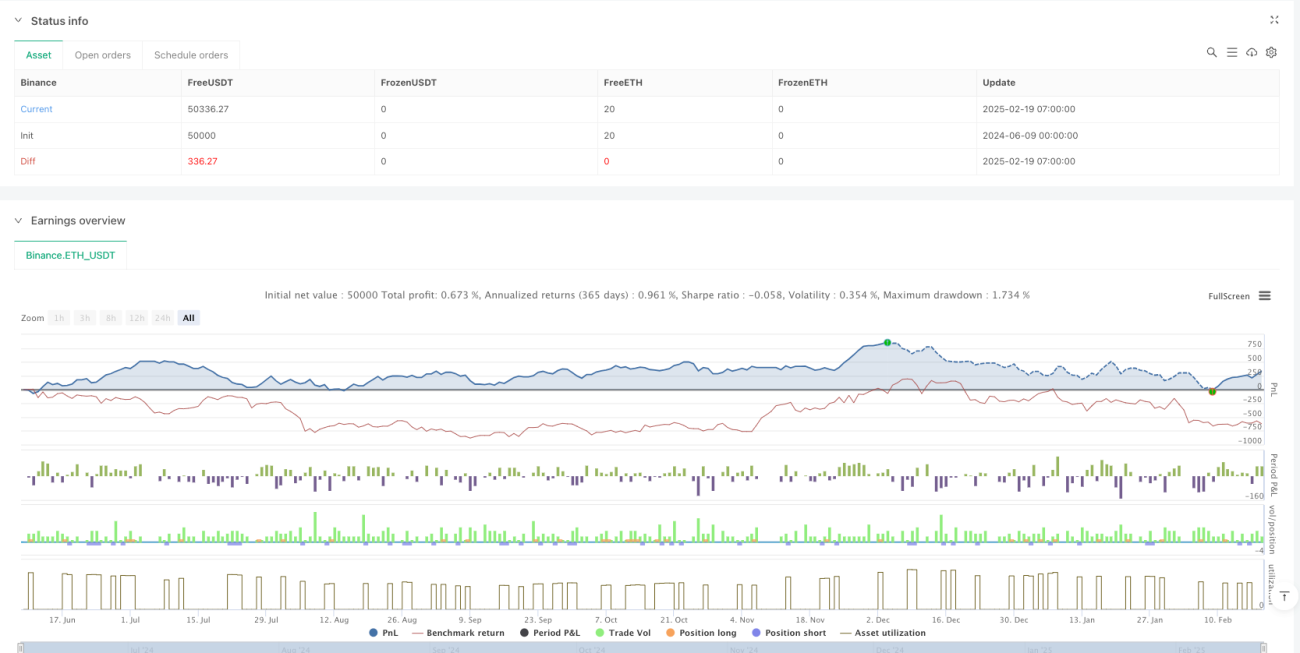
- Sử dụng hệ thống quản lý rủi ro động dựa trên quyền lợi tài khoản. Số tiền rủi ro cho mỗi giao dịch được cố định là 1% quyền lợi tài khoản, dừng lỗ được thiết lập là 1% giá nhập, và dừng lỗ được thiết lập là 2 lần khoảng cách dừng lỗ.
- Chiến lược tự động tính toán quy mô giao dịch, đảm bảo số tiền rủi ro cho mỗi giao dịch luôn ở mức dự kiến.
Lợi thế chiến lược
- Hệ thống tín hiệu đơn giản và đáng tin cậy: sử dụng hệ thống giao chéo hai đường đồng nhất cổ điển, dễ hiểu và bảo trì.
- Kiểm soát rủi ro tốt: tích hợp các chức năng dừng lỗ và chặn, hạn chế tổn thất tối đa cho mỗi giao dịch.
- Quản lý vị trí động: Tự động điều chỉnh quy mô giao dịch theo quyền lợi của tài khoản, tránh rủi ro do giao dịch tiền cố định.
- Hiển thị hiệu quả: hiển thị rõ ràng trên biểu đồ các tín hiệu giao dịch, mức dừng và dừng để dễ dàng theo dõi và phân tích.
- Các tham số có thể được điều chỉnh: Các tham số chính có thể được điều chỉnh thông qua giao diện đầu vào để thích ứng với các môi trường thị trường khác nhau.
Rủi ro chiến lược
- Rủi ro thị trường chấn động: Có thể có các tín hiệu phá vỡ giả thường xuyên trong tình huống chấn động ngang, dẫn đến tổn thất dừng liên tục.
- Rủi ro trượt: Trong một thị trường biến động mạnh, giá giao dịch thực tế có thể có sự lệch lớn so với giá lý thuyết.
- Rủi ro hệ thống: Giảm lỗ có thể không có hiệu lực khi thị trường nhảy vọt hoặc một sự kiện lớn.
- Rủi ro tối ưu hóa tham số: Các tham số tối ưu hóa quá mức có thể dẫn đến việc chiến lược không hoạt động tốt trong thực tế.
Hướng tối ưu hóa chiến lược
- Thêm bộ lọc xu hướng: Bạn có thể thêm các chỉ số xu hướng như ADX để thực hiện giao dịch khi có xu hướng mạnh.
- Phương pháp tối ưu hóa dừng lỗ: Có thể xem xét dừng động thích ứng với tỷ lệ dao động, tăng tính linh hoạt của dừng lỗ.
- Tiếp theo là việc đưa ra các chỉ số khối lượng giao dịch: kết hợp phân tích khối lượng giao dịch để tăng độ tin cậy của tín hiệu giao dịch.
- Thêm bộ lọc thời gian: Tránh giao dịch trong thời gian mở và đóng cửa có biến động lớn.
- Tăng kiểm soát rút tiền: thiết lập giới hạn rút tiền tối đa, tự động dừng giao dịch khi thua lỗ đạt đến mức nhất định.
Tóm tắt
Đây là một hệ thống giao dịch thông minh kết hợp các phương pháp phân tích kỹ thuật cổ điển với các khái niệm quản lý rủi ro hiện đại. Bằng cách nắm bắt xu hướng bằng hai đường thẳng chéo, sử dụng quản lý rủi ro động để kiểm soát rủi ro, thực hiện tự động hóa giao dịch. Mặc dù hệ thống vẫn còn một số nơi cần được tối ưu hóa, nhưng khái niệm thiết kế tổng thể tiên tiến và có giá trị thực tế tốt.
- 1