Chiến lược giao dịch thông minh kết hợp nhiều chỉ báo ATR dừng lỗ theo sau
ATR EMA VWMA SMA JLines Cloud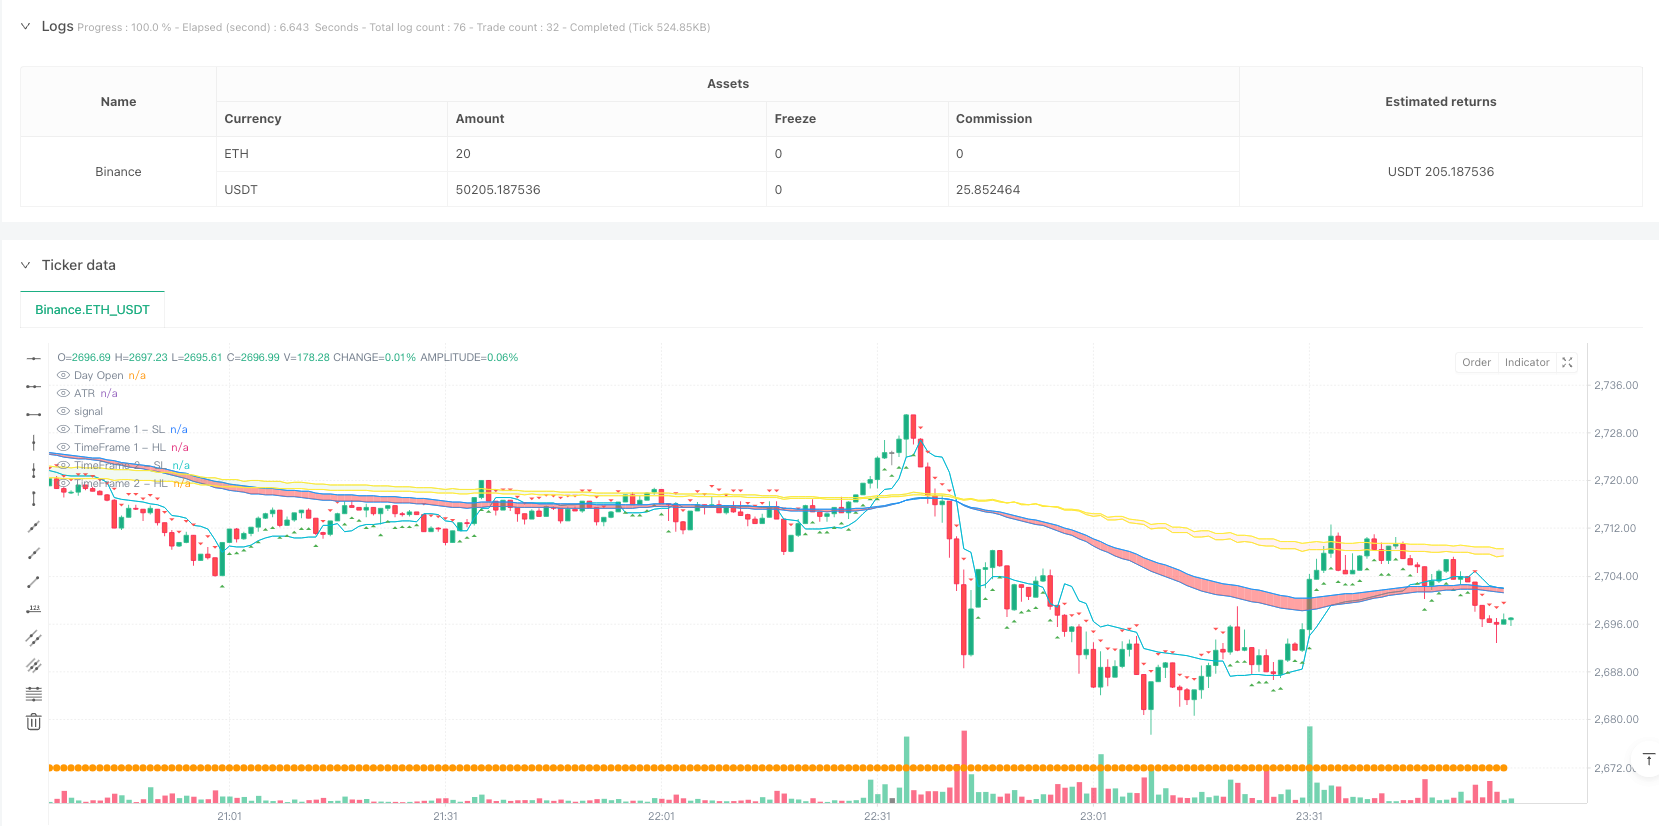
Tổng quan
Đây là một chiến lược giao dịch thông minh kết hợp nhiều chỉ số kỹ thuật, chủ yếu dựa trên chỉ số ATR để thực hiện chức năng theo dõi dừng lỗ. Chiến lược này đồng thời tích hợp các chỉ số phân tích đa chiều như đám mây đường thẳng ((JLines Cloud), phân tích khối lượng giao dịch và giá mở cửa trong ngày, đặc biệt phù hợp để giao dịch trong chu kỳ thời gian 3 phút và 5 phút.
Nguyên tắc chiến lược
Trung tâm của chiến lược là hệ thống theo dõi dừng lỗ được xây dựng dựa trên chỉ số ATR. Nó sử dụng 10 chu kỳ ATR và 2 lần ATR để tính toán đường dừng động.
- ATR theo dõi đột phá của đường dừng
- Xu hướng của JLines Cloud trong hai giai đoạn
- Giá so với giá mở cửa trong ngày
- Xác nhận khối lượng giao dịch bất thường
Lợi thế chiến lược
- Bảo vệ dừng lỗ động - cung cấp bảo vệ dừng lỗ linh hoạt để thích ứng với biến động thị trường thông qua chỉ số ATR
- Xác định xu hướng đa chiều - Sử dụng kết hợp đường trung bình của các giai đoạn thời gian khác nhau để tăng độ chính xác trong việc đánh giá xu hướng
- Xác minh khối lượng giao dịch - Tăng xác nhận giao dịch thông qua phân tích khối lượng giao dịch bất thường
- Quản lý rủi ro tốt - Cơ chế bảo vệ kép bao gồm mục tiêu dừng lỗ và lợi nhuận cố định
- Khả năng thích ứng - có thể điều chỉnh các tham số theo các điều kiện thị trường khác nhau
Rủi ro chiến lược
- Tính nhạy cảm tham số - chọn chu kỳ ATR và nhân có thể ảnh hưởng đáng kể đến hiệu suất của chiến lược
- Tùy thuộc vào điều kiện thị trường - có thể tạo ra các tín hiệu sai lệch thường xuyên trong thị trường ngang
- Hạn chế nhiều điều kiện - Điều kiện nhập cảnh nghiêm ngặt có thể dẫn đến việc bỏ lỡ một số cơ hội giao dịch
- Tác động điểm trượt - Trong thời gian có biến động cao, giá thực hiện có thể có sự lệch lạc lớn so với giá tín hiệu
Hướng tối ưu hóa chiến lược
- Điều chỉnh tham số động - có thể tự động điều chỉnh tham số ATR theo biến động của thị trường
- Bộ lọc thời gian - thêm bộ lọc thời gian giao dịch, tránh các giai đoạn biến động cao của thị trường mở và đóng cửa
- Bộ lọc cường độ xu hướng - giới thiệu chỉ số cường độ xu hướng để cải thiện độ chính xác của phán đoán xu hướng
- Tối ưu hóa quản lý rủi ro - thực hiện tỷ lệ dừng lỗ động, thích ứng với các môi trường thị trường khác nhau
- Tăng cường phân tích khối lượng giao dịch - Phương pháp phân tích khối lượng giao dịch tinh tế hơn, tăng độ chính xác xác nhận giao dịch
Tóm tắt
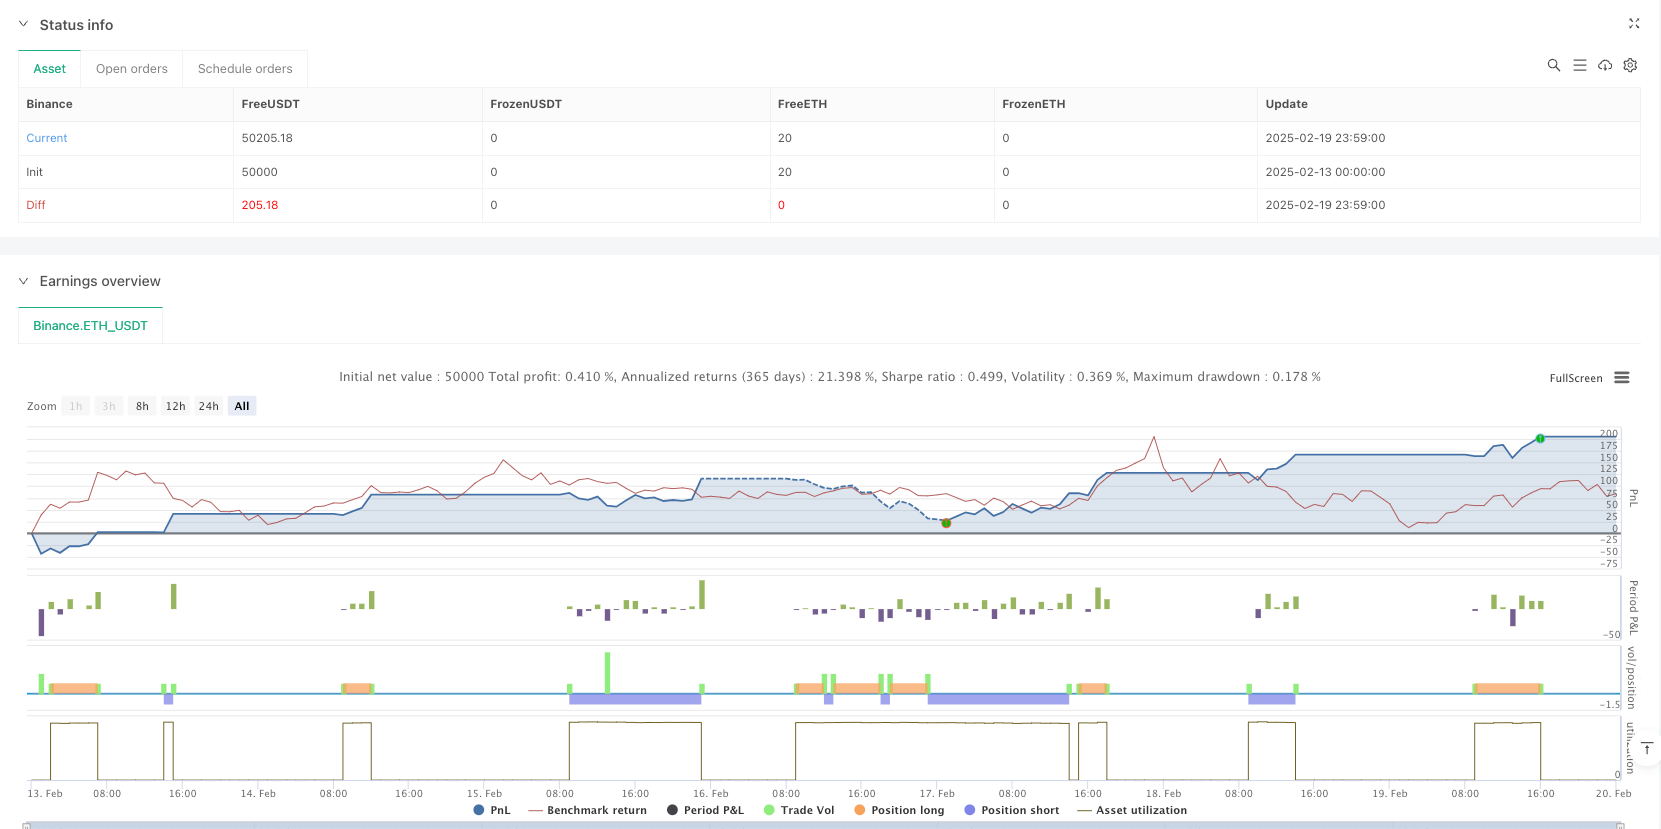
Đây là một hệ thống giao dịch hoàn chỉnh kết hợp nhiều chỉ số kỹ thuật, cung cấp quản lý rủi ro cốt lõi thông qua ATR theo dõi dừng lỗ, đồng thời sử dụng đám mây đồng nhất và phân tích khối lượng giao dịch để cung cấp xác nhận giao dịch. Ưu điểm của chiến lược nằm trong khung phân tích thị trường toàn diện và hệ thống quản lý rủi ro hoàn thiện, nhưng cần tối ưu hóa tham số cho môi trường thị trường cụ thể.
/*backtest
start: 2025-02-13 00:00:00
end: 2025-02-20 00:00:00
period: 1m
basePeriod: 1m
exchanges: [{"eid":"Binance","currency":"ETH_USDT"}]
*/

//@version=6
strategy("AI trade Roney nifty value", overlay=true)

// User Inputs
atrPeriod = input.int(10, "ATR Period")
atrMultiplier = input.float(2, "ATR Multiplier")
target = input.float(40, "Target")
stopLoss = input.float(40, "Stop Loss")

// Calculate ATR-based trailing stop
atr = ta.atr(atrPeriod)
nLoss = atrMultiplier * atr
var float xATRTrailingStop = na

if na(xATRTrailingStop)
    xATRTrailingStop := close - nLoss
else
    if close > xATRTrailingStop[1] and close[1] > xATRTrailingStop[1]
        xATRTrailingStop := math.max(xATRTrailingStop[1], close - nLoss)
    else if close < xATRTrailingStop[1] and close[1] < xATRTrailingStop[1]
        xATRTrailingStop := math.min(xATRTrailingStop[1], close + nLoss)
    else
        xATRTrailingStop := close > xATRTrailingStop[1] ? close - nLoss : close + nLoss

// Define position and entry/exit prices
var int pos = na
pos := close[1] < xATRTrailingStop[1] and close > xATRTrailingStop[1] ? 1 :
       close[1] > xATRTrailingStop[1] and close < xATRTrailingStop[1] ? -1 : pos[1]

var bool isLong = false
var bool isShort = false

var float entryPrice = na
var float exitPrice = na
var float exitStop = na

// JLines Cloud indicator
sl = input.int(72, "Smaller length")
hl = input.int(89, "Higher length")

res = input.timeframe("1", "JLines - Time Frame 1")
res1 = input.timeframe("3", "JLines - Time Frame 2")
enable515 = input.bool(false, "5/15 EMA")
res2 = input.timeframe("5", "5/15 EMA")

ema1_72 = request.security(syminfo.tickerid, res, ta.ema(close, sl))
ema1_89 = request.security(syminfo.tickerid, res, ta.ema(close, hl))
ema2_72 = request.security(syminfo.tickerid, res1, ta.ema(close, sl))
ema2_89 = request.security(syminfo.tickerid, res1, ta.ema(close, hl))
ema3_5 = request.security(syminfo.tickerid, res2, ta.ema(close, 5))
ema3_15 = request.security(syminfo.tickerid, res2, ta.ema(close, 15))

// Plot JLines Cloud
p1_1 = plot(ema1_72, "TimeFrame 1 - SL", color=color.blue, display=display.none)
p1_2 = plot(ema1_89, "TimeFrame 1 - HL", color=color.blue, display=display.none)
p2_1 = plot(ema2_72, "TimeFrame 2 - SL", color=color.yellow, display=display.none)
p2_2 = plot(ema2_89, "TimeFrame 2 - HL", color=color.yellow, display=display.none)
p3_1 = plot(enable515 ? ema3_5 : na, "Late Day Fade - 5 EMA", color=color.yellow, display=display.none)
p3_2 = plot(enable515 ? ema3_15 : na, "Late Day Fade - 15 EMA", color=color.yellow, display=display.none)

fill(p1_1, p1_2, color=ema1_72 > ema1_89 ? color.new(color.green, 30) : color.new(color.red, 30), title="Background 1")
fill(p2_1, p2_2, color=ema2_72 > ema2_89 ? color.new(color.green, 90) : color.new(color.red, 90), title="Background 2")
fill(p3_1, p3_2, color=enable515 ? (ema3_5 > ema3_15 ? color.new(color.blue, 50) : color.new(color.red, 50)) : na, title="Late Day Fade")

// Plot Buy and Sell signals
plotshape(pos == 1, title="Buy", style=shape.triangleup, location=location.belowbar, color=color.green)
plotshape(pos == -1, title="Sell", style=shape.triangledown, location=location.abovebar, color=color.red)

// Volume Analysis
vol_length = input.int(20, "Volume SMA length", minval=1)
vol_avg = ta.sma(volume, vol_length)

unusual_vol_down = volume > vol_avg * 1.2 and close < open
unusual_vol_up = volume > vol_avg * 1.2 and close > open

barcolor(unusual_vol_down or unusual_vol_up ? color.yellow : na)

// ATR Indicator
len2 = input.int(20, minval=1, title="Smooth")
src = input.source(close, title="Source")
out = ta.vwma(src, len2)
avg1 = math.avg(out, xATRTrailingStop) // FIXED: Replaced `ta.avg()` with `math.avg()`

plot(avg1, color=color.aqua, title="ATR")

// Daily Open Line
dl = input.bool(true, "Show daily Open")
dopen = request.security(syminfo.tickerid, "D", open)
plot(dl ? dopen : na, title="Day Open", color=color.orange, style=plot.style_circles, linewidth=2)

// Strategy Entry Conditions
if pos == 1 and not isLong and ema1_72 > ema1_89 and ema2_72 > ema2_89 and ema1_72 > ema2_72 and close > dopen
    entryPrice := close
    exitPrice := close + target
    exitStop := entryPrice - stopLoss
    strategy.entry("Buy", strategy.long)
    strategy.exit("buy_target", "Buy", limit=exitPrice)
    isLong := true
    isShort := false

if pos == -1 and not isShort and ema1_72 < ema1_89 and ema2_72 < ema2_89 and ema1_72 < ema2_72 and close < dopen
    entryPrice := close
    exitPrice := close - target
    exitStop := entryPrice + stopLoss
    strategy.entry("Sell", strategy.short)
    strategy.exit("Sell_target", "Sell", limit=exitPrice)
    isLong := false
    isShort := true

// Stop Loss Handling
if strategy.position_size > 0 and close < entryPrice - stopLoss
    strategy.close("Buy", comment="Buy_Stop Loss")

if strategy.position_size < 0 and close > entryPrice + stopLoss
    strategy.close("Sell", comment="Sell_Stop Loss")