
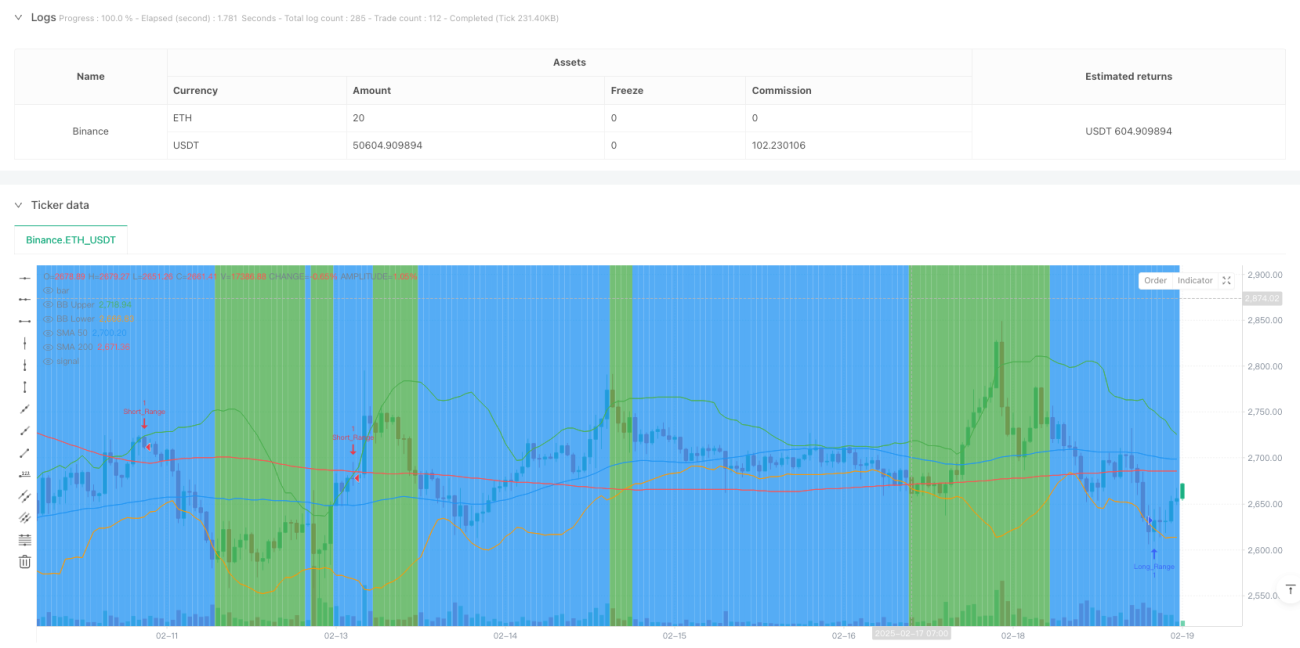
Tổng quan
Chiến lược này là một hệ thống giao dịch tự điều chỉnh kết hợp theo dõi xu hướng và giao dịch trong khoảng. Hệ thống xác định tình trạng thị trường động thông qua chỉ số ADX, sử dụng các chiến lược giao dịch khác nhau trong thị trường xu hướng và thị trường chấn động. Trong thị trường xu hướng, chiến lược sử dụng tín hiệu chéo đường trung bình di chuyển kết hợp với xác nhận RSI và MACD; trong thị trường chấn động, chiến lược sử dụng phá vỡ băng tròn kết hợp với tín hiệu mua bán quá mức RSI để giao dịch. Hệ thống cũng tích hợp cơ chế dừng lỗ động dựa trên ATR, kiểm soát rủi ro hiệu quả.
Nguyên tắc chiến lược
Trung tâm của chiến lược là cơ chế nhận dạng trạng thái thị trường. Chiến lược theo dõi xu hướng được kích hoạt khi ADX lớn hơn 25 được xác định là thị trường xu hướng:
- Điều kiện đa đầu: 50 đường trung bình trên đường trung bình 200 ngày, trong khi RSI lớn hơn 50 và đường MACD trên đường tín hiệu
- Điều kiện đầu trống: 50 đường trung bình dưới đường trung bình 200 ngày, đồng thời RSI nhỏ hơn 50 và đường MACD dưới đường tín hiệu
Khi ADX nhỏ hơn hoặc bằng 25 được xác định là thị trường chấn động, hãy kích hoạt chiến lược giao dịch trong khoảng thời gian:
- Điều kiện đa đầu: Giá lên qua đường dây Bollinger và RSI nhỏ hơn 40
- Điều kiện đầu trống: Giá đi qua đường dây Bollinger và RSI lớn hơn 60
Cài đặt dừng lỗ sử dụng phương thức nhân động của ATR, dừng lỗ là 1,5 lần ATR và dừng lỗ là 3 lần ATR.
Lợi thế chiến lược
- Thị trường thích ứng mạnh: có thể tự động chuyển đổi chiến lược giao dịch theo tình trạng thị trường
- Xác nhận đa tín hiệu: Giảm tín hiệu giả thông qua kết hợp nhiều chỉ số kỹ thuật
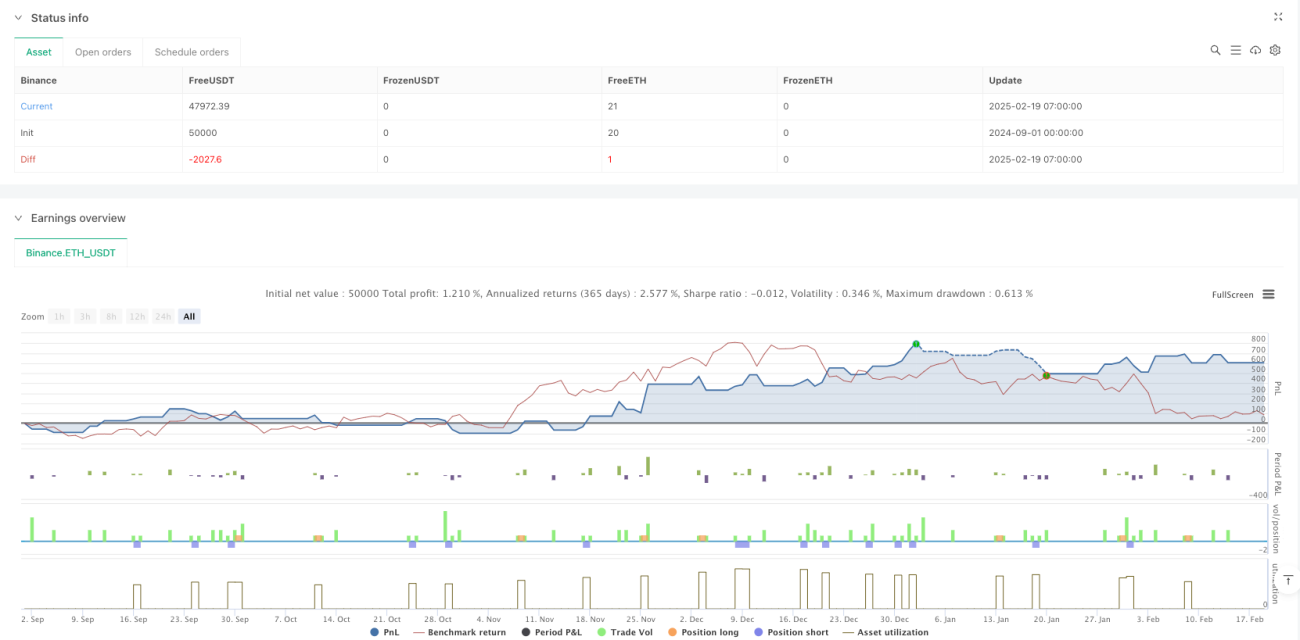
- Kiểm soát rủi ro tốt hơn: Sử dụng cơ chế dừng lỗ động để thích ứng với biến động thị trường
- Logic chiến lược rõ ràng: tiêu chuẩn phán đoán xu hướng và khoảng thời gian rõ ràng, cho phép điều chỉnh tối ưu hóa
- Hiệu quả trực quan: phân biệt thị trường bằng màu nền, trực quan
Rủi ro chiến lược
- Tín hiệu chậm trễ: Các chỉ số như đường trung bình di chuyển có độ trễ, có thể bỏ lỡ điểm nhập cảnh tốt nhất
- Rủi ro phá vỡ giả: Brin có thể có tín hiệu phá vỡ giả trong thị trường bất ổn
- Tính nhạy cảm của tham số: ADX, ATR và các tham số khác có thể ảnh hưởng đến hiệu suất của chiến lược
- Rủi ro chuyển đổi thị trường: có thể tạo ra tín hiệu sai trong giai đoạn chuyển đổi giữa xu hướng và biến động
- Rủi ro dừng lỗ: ATR dừng lỗ với số nhân cố định có thể quá lớn trong thời gian biến động cao
Hướng tối ưu hóa chiến lược
- Tiến hành phân tích số lượng giao dịch: Thêm các yếu tố số lượng giao dịch vào xác nhận tín hiệu để tăng độ tin cậy tín hiệu
- Tối ưu hóa phán đoán tình trạng thị trường: Có thể xem xét chuyển đổi ADX thành giảm giá động hoặc kết hợp với các chỉ số khác
- Cải thiện cơ chế dừng lỗ: giới thiệu dừng theo dõi hoặc điều chỉnh ATR theo biến động của tỷ lệ dao động
- Thêm bộ lọc thời gian: thêm giới hạn thời gian giao dịch, tránh thời gian lưu động thấp
- Cải thiện cơ chế xác nhận tín hiệu: Có thể xem xét thêm phân tích hình dạng giá để cải thiện chất lượng tín hiệu
Tóm tắt
Chiến lược này được thực hiện thông qua việc xác định động trạng thái thị trường và chuyển đổi chiến lược tương ứng, điều chỉnh cho các môi trường thị trường khác nhau. Chiến lược có tính thực tế tốt thông qua sự kết hợp của nhiều chỉ số kỹ thuật và cơ chế kiểm soát rủi ro động. Tuy nhiên, vẫn cần chú ý đến các rủi ro như trễ tín hiệu và đột phá giả, nên thử nghiệm đầy đủ và tối ưu hóa tham số trong thực tế.
- 1