
Tổng quan
Chiến lược này là một hệ thống giao dịch theo dõi xu hướng toàn diện, kết hợp nhiều chỉ số kỹ thuật để xác định xu hướng thị trường và thời gian giao dịch. Cốt lõi của chiến lược dựa trên tín hiệu chéo giữa trung bình di chuyển đơn giản nhanh và chậm (SMA) và xác nhận xu hướng thông qua chỉ số xu hướng tương đối yếu (RSI) và chỉ số xu hướng trung bình (ADX), đồng thời sử dụng sóng thực (ATR) để quản lý rủi ro.
Nguyên tắc chiến lược
Cơ chế hoạt động của chiến lược bao gồm các phần quan trọng sau:
- Nhận định xu hướng: Sử dụng giao chéo SMA10 và SMA200 để nắm bắt sự thay đổi xu hướng, đường nhanh vượt qua đường chậm được coi là tín hiệu đa, ngược lại là tín hiệu trống.
- Xác nhận xu hướng: Bằng cách xác nhận kép RSI và ADX, RSI cần phá vỡ mức 50 và ADX cần lớn hơn 20 để xác nhận cường độ của xu hướng.
- Kiểm soát rủi ro: Thiết lập dừng lỗ động dựa trên ATR và sử dụng quản lý tiền để hạn chế rủi ro giao dịch đơn lẻ.
- Quản lý vị trí: thực hiện cơ chế trailing stop, động điều chỉnh vị trí dừng lỗ để khóa lợi nhuận.
Lợi thế chiến lược
- Xác thực chéo đa chỉ số để tăng độ tin cậy tín hiệu
- Kết hợp cường độ và động lực của xu hướng để giảm nguy cơ phá vỡ giả
- Hệ thống quản lý rủi ro tốt, bao gồm kiểm soát vị trí và dừng lỗ động
- Thích ứng với nhiều chu kỳ thời gian ((M5-MN), có tính thích ứng mạnh mẽ
- Hỗ trợ giao dịch bảo hiểm, thêm các kịch bản ứng dụng chiến lược
Rủi ro chiến lược
- Thị trường chấn động có thể tạo ra các tín hiệu sai thường xuyên
- Đường trung bình dài có độ trễ cao, có thể bỏ lỡ cơ hội trong xu hướng ban đầu
- Bộ lọc đa chỉ số có thể gây ra một số tín hiệu hiệu quả bị bỏ lỡ
- Các tham số chỉ số cố định có thể không phù hợp với tất cả các môi trường thị trường
- Chi phí giao dịch có thể ảnh hưởng đến lợi nhuận của giao dịch ngắn hạn
Hướng tối ưu hóa chiến lược
- Tiếp theo, các nhà đầu tư có thể sử dụng các chỉ số tự điều chỉnh theo các biến động của thị trường.
- Tăng cơ chế nhận diện môi trường thị trường, sử dụng các tham số chiến lược khác nhau trong các điều kiện thị trường khác nhau
- Tối ưu hóa chương trình dừng lỗ, xem xét vị trí dừng lỗ kết hợp với thiết lập điểm kháng cự hỗ trợ
- Thêm chỉ số khối lượng giao dịch để tăng độ tin cậy tín hiệu
- Phát triển cơ chế chuyển đổi thị trường, tự động ngừng giao dịch trong môi trường thị trường không phù hợp
Tóm tắt
Chiến lược này xây dựng một hệ thống giao dịch theo dõi xu hướng tương đối hoàn chỉnh thông qua việc sử dụng kết hợp nhiều chỉ số kỹ thuật. Chiến lược này được thiết kế để tập trung vào độ tin cậy tín hiệu và quản lý rủi ro, có tính thực tế tốt. Bằng cách thực hiện các khuyến nghị tối ưu hóa, chiến lược có khả năng nâng cao hiệu suất hơn nữa.
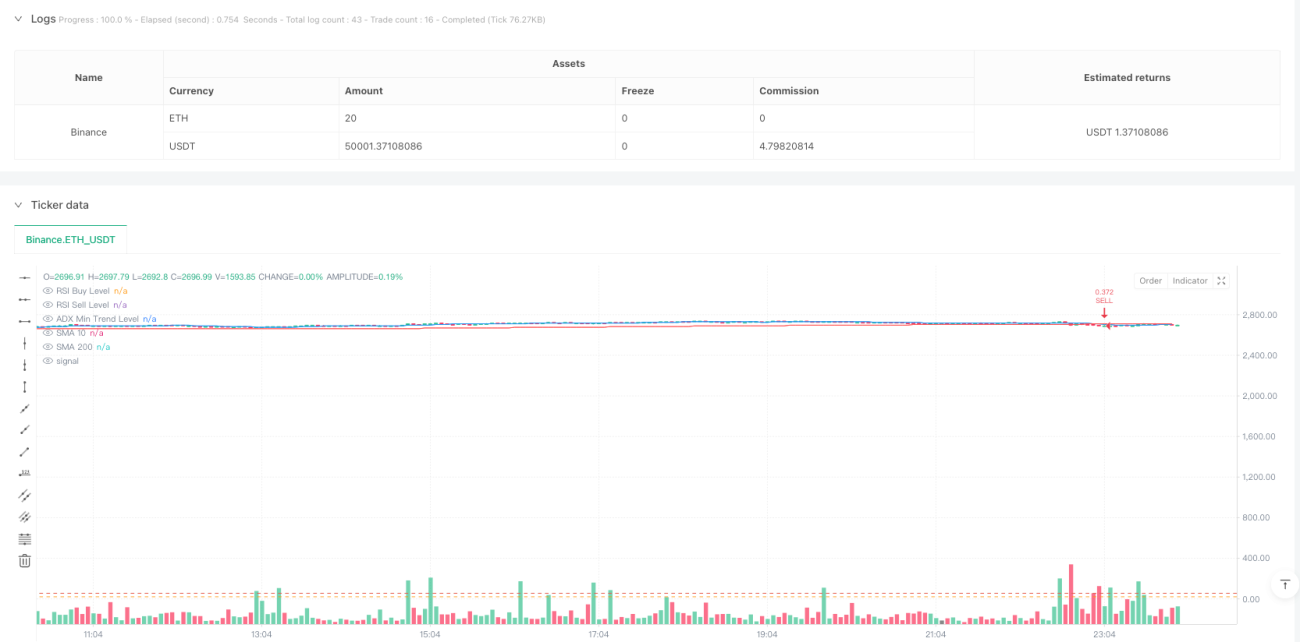
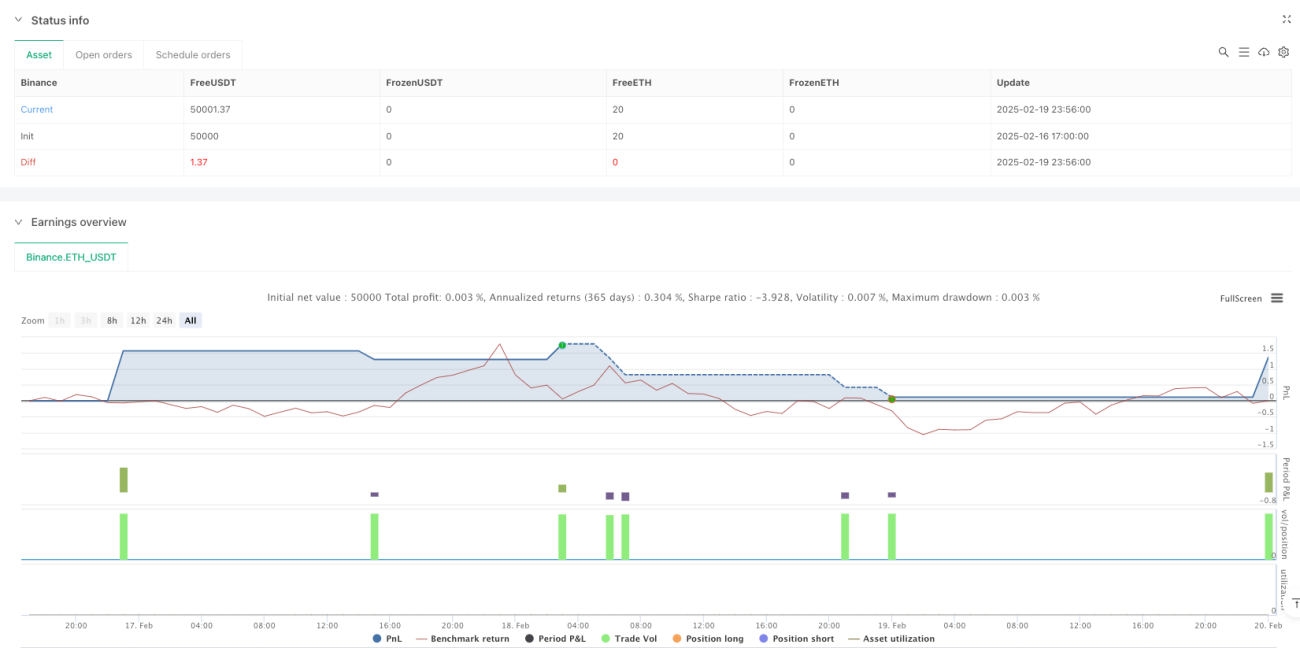
/*backtest
start: 2025-02-16 17:00:00
end: 2025-02-20 00:00:00
period: 4m
basePeriod: 4m
exchanges: [{"eid":"Binance","currency":"ETH_USDT"}]
*/

//@version=6
strategy("SMA + RSI + ADX + ATR Strategy", overlay=true, default_qty_type=strategy.percent_of_equity, default_qty_value=2)

// === Input Parameters ===- 1