
Tổng quan
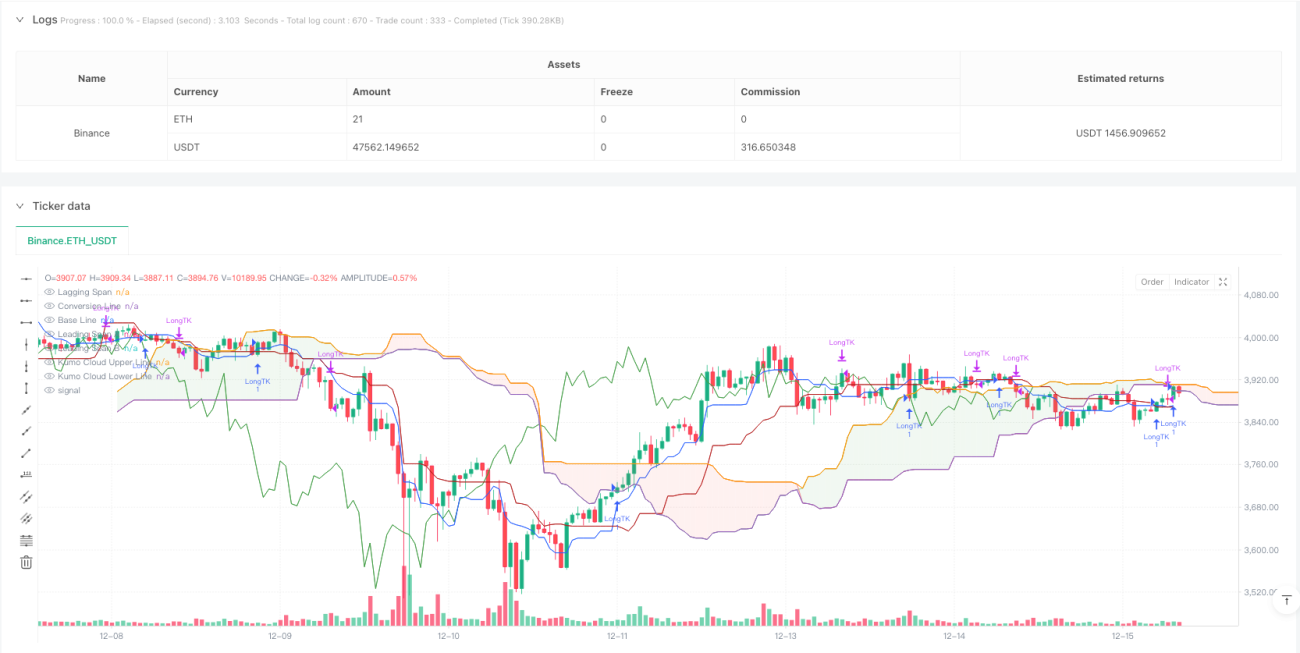
Chiến lược này dựa trên một phiên bản cải tiến của hệ thống chuyển đổi đám mây thị trường cổ điển (Ichimoku Kinko Hyo) để xác định tín hiệu giao dịch thông qua sự giao thoa động giữa đường chuyển đổi và đường chuẩn. Chiến lược này dựa trên hệ thống đám mây thị trường truyền thống, thêm logic tạo và thực hiện tín hiệu giao dịch tự động và kết hợp với nhãn hình ảnh để tăng khả năng đọc được xu hướng thị trường.
Nguyên tắc chiến lược
Cốt lõi của chiến lược là dựa trên năm đường cong chính của hệ thống đám mây thị trường: đường chuyển đổi (thời gian 9), đường chuẩn (thời gian 26), đường dẫn A, đường dẫn B (thời gian 52) và đường tụt hậu. Các tín hiệu giao dịch quan trọng nhất trong số đó đến từ sự giao thoa của đường chuyển đổi và đường chuẩn.
Lợi thế chiến lược
- Theo dõi xu hướng có hệ thống - Có thể nắm bắt toàn diện xu hướng thị trường thông qua các chỉ số kết hợp trên nhiều khung thời gian.
- Hình ảnh trực quan - Sử dụng thẻ màu và hiển thị hình ảnh đám mây, tín hiệu giao dịch được hiển thị rõ ràng.
- Quản lý rủi ro tích hợp - có cơ chế dừng lỗ tích hợp, tự động thanh toán khi thị trường đảo ngược.
- Khả năng thích ứng - Các tham số có thể được điều chỉnh để thích ứng với các môi trường thị trường khác nhau.
- Tín hiệu ổn định - Sử dụng đường chéo đồng nhất để lọc tín hiệu giả, cải thiện chất lượng giao dịch.
Rủi ro chiến lược
- Trở lại xu hướng chậm trễ - Có một số sự chậm trễ do sử dụng đường trung bình di chuyển.
- Không áp dụng cho thị trường chấn động - có thể tạo ra tín hiệu giả trong giai đoạn sắp xếp theo chiều ngang.
- Tính nhạy cảm của tham số - các thiết lập tham số khác nhau có thể ảnh hưởng đáng kể đến hiệu suất của chiến lược.
- Sự phức tạp của bản đồ đám mây - nhiều đường dây bị đan xen có thể gây ra khó khăn trong việc giải thích tín hiệu.
Hướng tối ưu hóa chiến lược
- Thêm bộ lọc tỷ lệ biến động - có thể thêm chỉ số ATR để điều chỉnh kích thước vị trí.
- Tối ưu hóa thời gian nhập cảnh - kết hợp với các chỉ số động lực như RSI để xác nhận tín hiệu giao dịch.
- Cơ chế dừng lỗ hoàn thiện - Có thể thiết lập dừng lỗ động dựa trên vị trí hỗ trợ trên bản đồ đám mây.
- Tăng xác nhận khối lượng giao dịch - Kiểm tra khối lượng giao dịch khi tín hiệu được tạo ra, tăng độ tin cậy.
- Thêm bộ lọc môi trường thị trường - chọn môi trường giao dịch phù hợp thông qua chỉ số cường độ xu hướng.
Tóm tắt
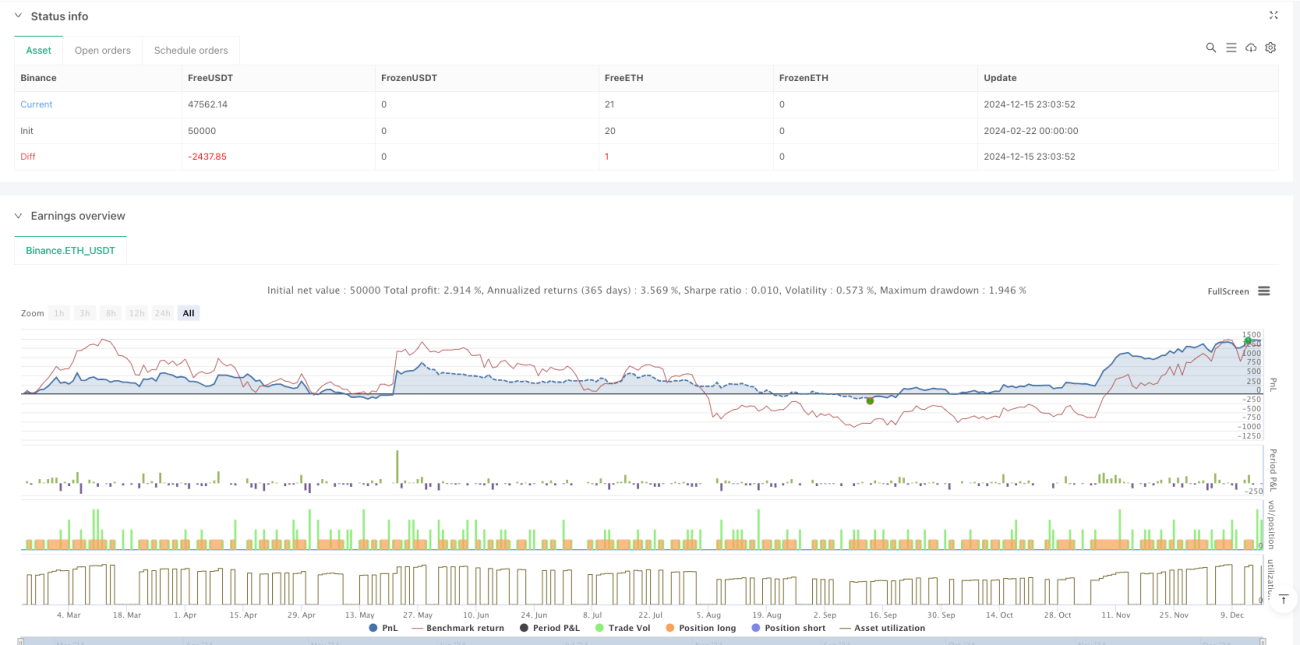
Chiến lược này xây dựng một hệ thống giao dịch theo dõi xu hướng hoàn chỉnh bằng cách cải tiến hệ thống đám mây thị trường truyền thống. Mặc dù có một số chậm trễ, nhưng có thể đạt được hiệu suất ổn định trong thị trường xu hướng thông qua việc lọc tín hiệu và quản lý rủi ro được tối ưu hóa.
/*backtest
start: 2024-02-22 00:00:00
end: 2024-12-16 00:00:00
period: 1h
basePeriod: 1h
exchanges: [{"eid":"Binance","currency":"ETH_USDT"}]
*/

//@version=6

strategy(title="Ichimoku Cloud with Lables", shorttitle="Ichimoku", overlay=true)
conversionPeriods = input.int(9, minval=1, title="Conversion Line Length")- 1