
Tổng quan
Chiến lược này là một hệ thống giao dịch sáng tạo dựa trên lỗ hổng giá trị công bằng (FVG) để nắm bắt các cơ hội giao dịch tiềm năng bằng cách xác định chênh lệch giá và khối lượng giao dịch bất thường trong thị trường. Chiến lược này kết hợp cơ chế tính toán động và xử lý thống nhất, không chỉ có thể xác định chính xác tín hiệu mua và bán, mà còn có thể giúp các nhà giao dịch hiểu rõ hơn về cấu trúc thị trường bằng cách hiển thị trực quan.
Nguyên tắc chiến lược
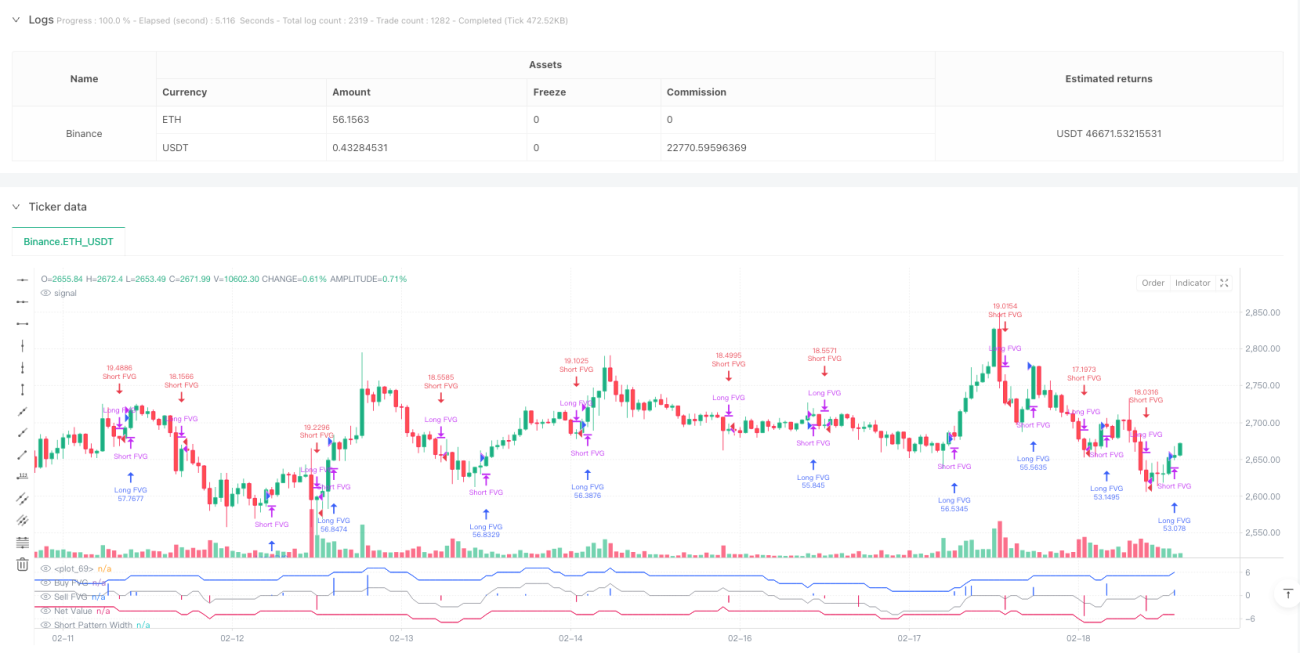
Trung tâm của chiến lược là để xác định các cơ hội giao dịch tiềm năng bằng cách giám sát các lỗ hổng giá giữa các dòng K liên tục. Cụ thể:
- Điều kiện hình thành FVG đa đầu là giá thấp nhất của dòng K hiện tại cao hơn giá cao nhất trước hai dòng K
- Điều kiện hình thành FVG (SFVG) là giá cao nhất của dòng K hiện tại thấp hơn giá thấp nhất trước hai dòng K
- Chiến lược giới thiệu cơ chế xác thực dựa trên khối lượng giao dịch và kích thước lỗ hổng, chỉ có FVG đáp ứng các điều kiện xác thực sẽ kích hoạt tín hiệu giao dịch
- Sử dụng cửa sổ đếm động 50 chu kỳ để tích lũy số lượng FVG không gian
- Chuyển đổi chiều rộng lỗ hổng thành một chỉ số trực quan hơn bằng cách xử lý thống nhất
Lợi thế chiến lược
- Hệ thống có cơ chế xác minh tín hiệu hoàn chỉnh để cải thiện chất lượng tín hiệu bằng cách xác nhận kép khối lượng giao dịch và độ rộng lỗ hổng
- Cửa sổ đếm động có thể nắm bắt hiệu quả sự thay đổi của xu hướng thị trường
- Phương pháp thống nhất hóa cho phép các tín hiệu từ các thời kỳ khác nhau có thể so sánh được
- Chiến lược có chức năng quản lý vị trí tự động, tự động xóa vị trí giữ ngược trước khi mở vị trí mới
- Hiển thị hiệu quả tốt giúp các nhà giao dịch hiểu được tình trạng thị trường
Rủi ro chiến lược
- Các tín hiệu FVG có thể tạo ra tín hiệu giả trong thị trường biến động cao
- Các tham số xác thực cố định có thể không áp dụng cho tất cả các môi trường thị trường
- Không có thiết lập các cơ chế dừng và dừng, có thể dẫn đến rút lui lớn hơn
- Giao dịch thường xuyên có thể dẫn đến chi phí giao dịch cao hơn
Những rủi ro này nên được quản lý bằng cách thiết lập vị trí dừng lỗ thích hợp và giới thiệu bộ lọc môi trường thị trường.
Hướng tối ưu hóa chiến lược
- Tiến hành cơ chế điều chỉnh tham số thích ứng để chiến lược có thể thích ứng tốt hơn với các môi trường thị trường khác nhau
- Thêm bộ lọc xu hướng, chỉ giao dịch một chiều trong xu hướng mạnh
- Thiết kế hệ thống quản lý kho phức tạp hơn, bao gồm xây dựng kho theo lô và dừng lỗ động
- Tính toán chi phí giao dịch, tối ưu hóa tần suất giao dịch
- Kết hợp với các chỉ số kỹ thuật khác để tăng độ tin cậy tín hiệu
Tóm tắt
Đây là một chiến lược giao dịch sáng tạo dựa trên cấu trúc giá, nắm bắt cơ hội thị trường bằng cách xác định và xác minh thông minh các lỗ hổng giá trị công bằng. Ý tưởng thiết kế của chiến lược rõ ràng, phương thức thực hiện chuyên nghiệp, có khả năng mở rộng tốt.
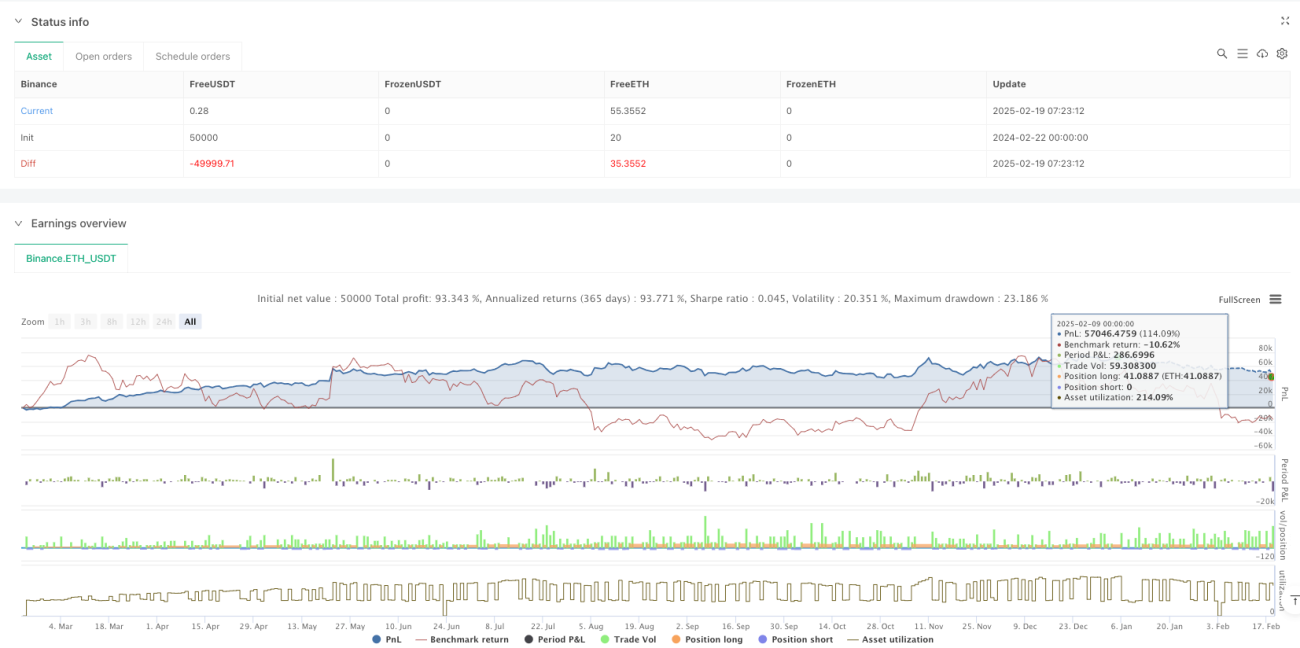
/*backtest
start: 2024-02-22 00:00:00
end: 2025-02-19 08:00:00
period: 1h
basePeriod: 1h
exchanges: [{"eid":"Binance","currency":"ETH_USDT"}]
*/

// ----------------------------------------------------------------------------
// This Pine Script™ code is subject to the terms of the Mozilla Public License
// 2.0 at https://mozilla.org/MPL/2.0/
// © OmegaTools- 1