
Tổng quan
Chiến lược này là một hệ thống giao dịch theo dõi xu hướng kết hợp nhiều chỉ số, kết hợp phân tích ba chiều của xu hướng thị trường, động lực và biến động. Lý thuyết cốt lõi là đánh giá xu hướng thị trường thông qua một đám mây chỉ số (Ichimoku Cloud), xác nhận động lực của MACD, lọc tình trạng biến động của thị trường bằng Bollinger Band Width, đồng thời giới thiệu cơ chế xác nhận xu hướng cấp tuần và cuối cùng quản lý rủi ro bằng cách dừng lỗ động dựa trên ATR.
Nguyên tắc chiến lược
Chiến lược sử dụng cơ chế lọc tín hiệu nhiều lớp: Đầu tiên, xác định xu hướng lớn của thị trường bằng cách đánh giá giá cả trên hoặc dưới đám mây bằng các khoảng A và B dẫn đầu của một chỉ số đám mây; tiếp theo, sử dụng đồ thị MACD để đánh giá cường độ động lực, yêu cầu đồ thị trực tiếp lớn hơn -0.05 trong giờ đầu, nhỏ hơn 0 trong giờ đầu; thứ ba, giới thiệu đường trung bình 50 chu kỳ của chu kỳ thời gian đường tròn để xác nhận hướng xu hướng cấp độ lớn hơn; thứ tư, sử dụng chỉ số băng thông Brin để lọc tỷ lệ biến động thấp, chỉ khi chiều rộng lớn hơn 0.02 khi mở vị trí.
Lợi thế chiến lược
- Bộ lọc tín hiệu đa chiều: Bằng cách kết hợp các chỉ số ba chiều của xu hướng, động lực và dao động, hiệu quả làm giảm tín hiệu giả.
- Phân tích nhiều chu kỳ thời gian: giới thiệu xác nhận xu hướng vòng quanh, tăng độ chính xác của hướng giao dịch.
- Quản lý rủi ro động: Cơ chế dừng lỗ thích ứng dựa trên ATR và băng thông Brin, bảo vệ lợi nhuận và cho phép xu hướng phát triển.
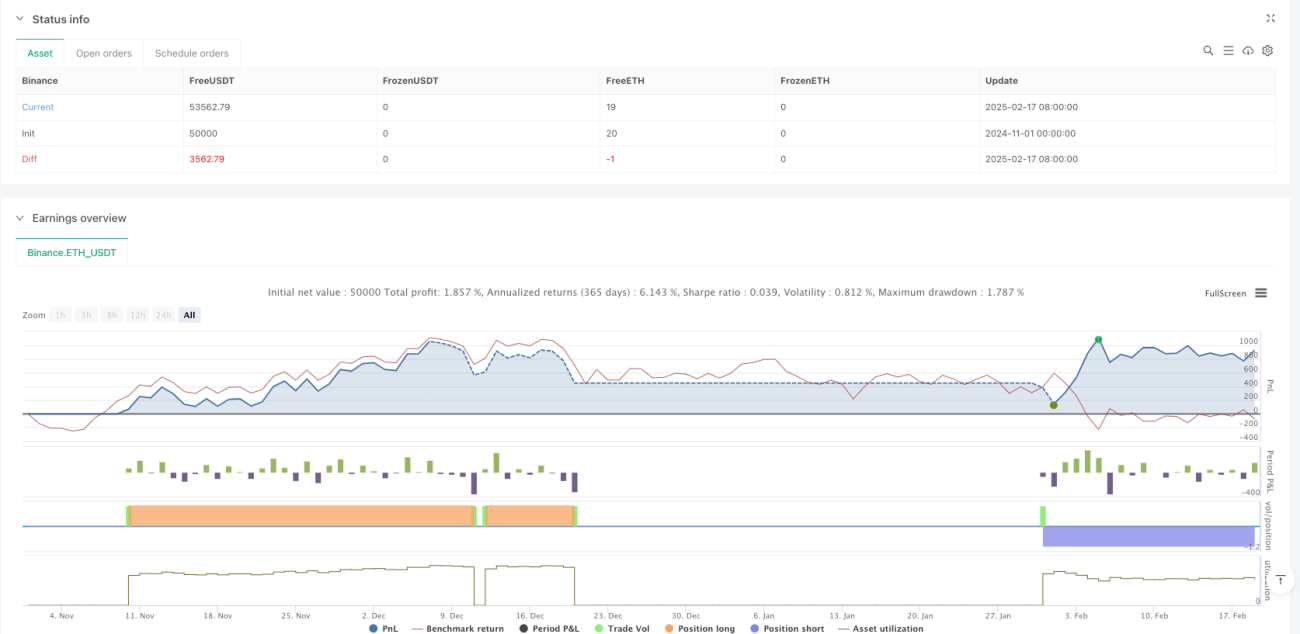
- Hiệu quả đánh giá rất tốt: lợi nhuận ròng 10,80%, tỷ lệ thua lỗ 2,593, tỷ lệ thắng 50,70%, mức thu hồi tối đa chỉ là 1,47%
Rủi ro chiến lược
- Xu hướng phụ thuộc: Chiến lược có thể tạo ra các tín hiệu sai lệch thường xuyên trong thị trường biến động.
- Nhận thức tham số: Nhiều tham số chỉ số cần được tối ưu hóa cho các điều kiện thị trường khác nhau.
- Rủi ro về sự trễ thời gian: Việc lọc nhiều tín hiệu có thể gây ra sự trễ thời gian nhập cảnh và bỏ lỡ một phần của hành động.
- Giới hạn của dự đoán: thành tích lịch sử không đại diện cho hiệu suất trong tương lai, đĩa thật cũng cần tính đến điểm trượt và phí xử lý.
Hướng tối ưu hóa chiến lược
- Tối ưu hóa hệ thống tín hiệu: Có thể giới thiệu các chỉ số động lực khác như RSI để tăng cường độ tin cậy tín hiệu.
- Tối ưu hóa quản lý vị trí: có thể điều chỉnh kích thước vị trí dựa trên biến động của tỷ lệ biến động.
- Tối ưu hóa cơ chế dừng: có thể thêm các điều kiện dừng di động hoặc dựa trên chỉ số kỹ thuật.
- Tối ưu hóa khả năng thích ứng của thị trường: tham số điều chỉnh động cho các tình trạng thị trường khác nhau.
Tóm tắt
Chiến lược này xây dựng một hệ thống theo dõi xu hướng hoàn chỉnh bằng cách kết hợp các chỉ số đa chiều và phân tích chu kỳ đa thời gian, và được trang bị cơ chế quản lý rủi ro động. Mặc dù phản hồi hoạt động tốt, nhưng vẫn cần chú ý đến rủi ro do sự thay đổi của môi trường thị trường gây ra, nên kiểm tra cẩn thận và tối ưu hóa liên tục trong thực tế.
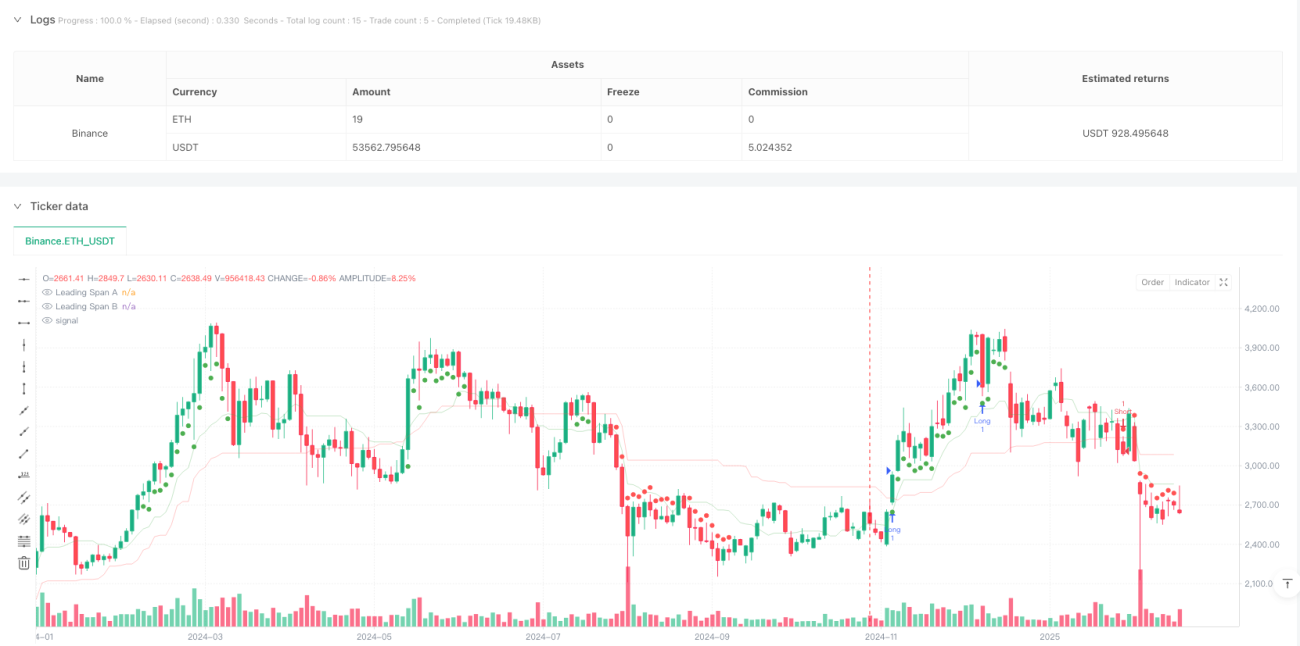
/*backtest
start: 2024-11-01 00:00:00
end: 2025-02-19 08:00:00
period: 2d
basePeriod: 2d
exchanges: [{"eid":"Binance","currency":"ETH_USDT"}]
*/

// This Pine Script™ code is subject to the terms of the Mozilla Public License 2.0 at https://mozilla.org/MPL/2.0/
// © FIWB
//@version=6
strategy("Momentum Edge Strategy - 1D BTC Optimized", overlay=true)- 1