
Tổng quan
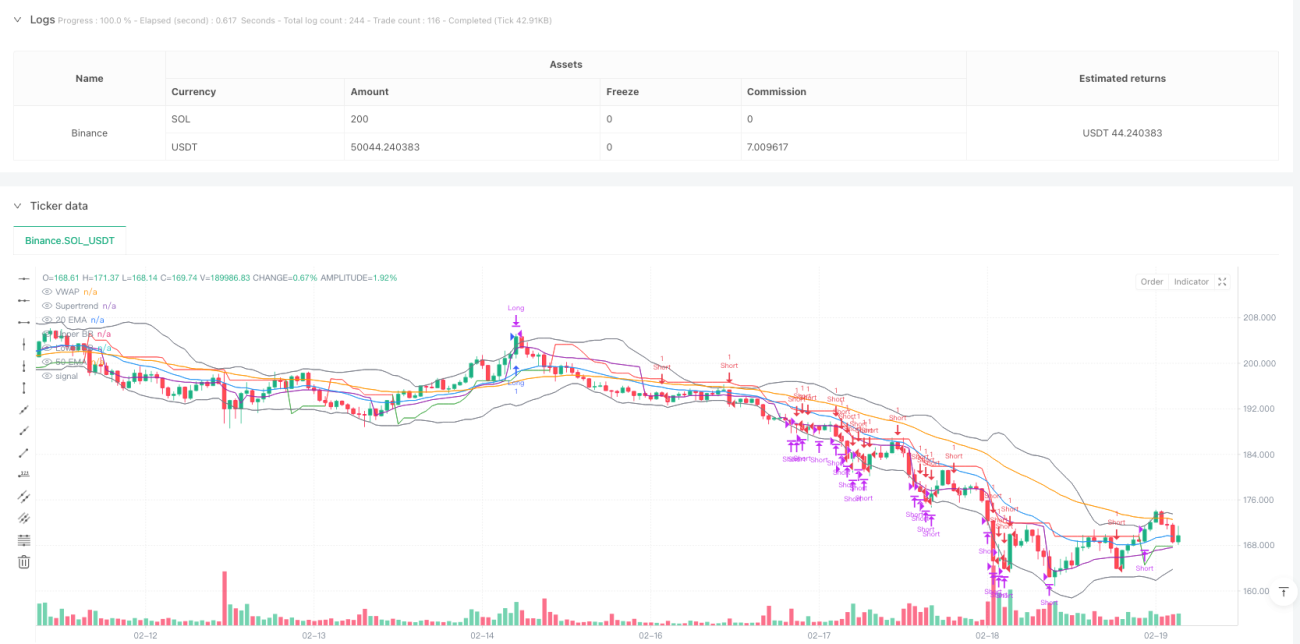
Chiến lược này là một hệ thống giao dịch tự điều chỉnh kết hợp theo dõi xu hướng và giao dịch trong khoảng. Nó sử dụng nhiều chỉ số kỹ thuật để phối hợp với nhau và chuyển đổi mô hình giao dịch linh hoạt trong các môi trường thị trường khác nhau. Chiến lược sử dụng các chỉ số như Supertrend, Moving Average, ADX, RSI và Bollinger Bands để xác định tình trạng thị trường và xác định tín hiệu giao dịch, đồng thời tham khảo giá với VWAP và thiết lập cơ chế dừng lỗ để kiểm soát rủi ro.
Nguyên tắc chiến lược
Lý luận cốt lõi của chiến lược được chia thành hai phần: theo dõi xu hướng và giao dịch trong khoảng thời gian. Trong thị trường xu hướng (được xác định bởi ADX> 25), chiến lược tạo tín hiệu dựa trên hướng Supertrend, giao điểm EMA và vị trí VWAP; trong thị trường xung đột, chiến lược sử dụng biên giới Brin và RSI để giao dịch vượt quá mức bán tháo.
- Mô hình theo dõi xu hướng: được kích hoạt khi ADX> 25, kết hợp với mối quan hệ vị trí của EMA chu kỳ 20/50, định hướng Supertrend và vị trí tổng hợp của giá so với VWAP
- Mô hình giao dịch khoảng: được kích hoạt khi ADX <25 và vào khi giá chạm biên giới Brin và RSI đạt cực điểm
- Các điều kiện xuất cảnh bao gồm: kích hoạt dừng lỗ, đảo ngược Supertrend hoặc RSI đạt cực
Lợi thế chiến lược
- Khả năng thích ứng: có thể tự động chuyển đổi mô hình giao dịch theo tình trạng thị trường
- Xác nhận đa dạng: sử dụng xác thực chéo nhiều chỉ số để tăng độ tin cậy tín hiệu
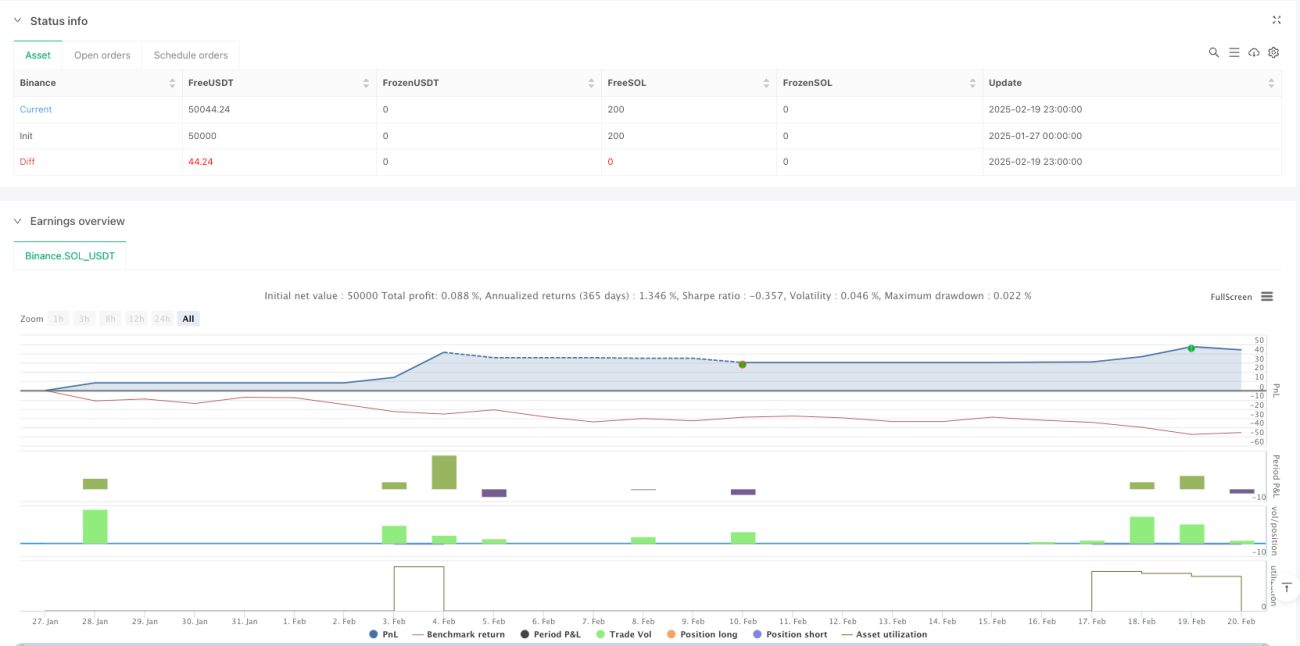
- Kiểm soát rủi ro hoàn hảo: thiết lập tỷ lệ dừng cố định và sử dụng RSI cực đoan để điều chỉnh động
- Khả năng toàn diện: nắm bắt xu hướng và lợi nhuận trong thị trường bất ổn
- Hỗ trợ hình ảnh: cung cấp các biểu đồ đồ họa về các chỉ số quan trọng để phân tích và đưa ra quyết định
Rủi ro chiến lược
- Nhận thức tham số: thiết lập nhiều tham số chỉ số có thể ảnh hưởng đến hiệu suất của chiến lược
- Dấu hiệu chậm trễ: Chỉ số kỹ thuật tự nó có một chút chậm trễ
- Rủi ro đột phá giả mạo: Có thể tạo ra tín hiệu giả mạo trên thị trường ngang
- Tính phức tạp của tính toán: tính toán thời gian thực của nhiều chỉ số có thể ảnh hưởng đến hiệu quả thực hiện
- Thị trường thích ứng: có thể không hoạt động tốt trong một số môi trường thị trường cụ thể
Hướng tối ưu hóa chiến lược
- Điều chỉnh tham số động: có thể tự động điều chỉnh các tham số chỉ số theo tỷ lệ dao động
- Tiến hành phân tích lưu lượng giao thông: tăng các chỉ số lưu lượng giao thông để xác minh hiệu quả của tín hiệu
- Tối ưu hóa cơ chế dừng lỗ: Có thể xem xét sử dụng ATR dừng động
- Thêm bộ lọc thời gian: thêm cửa sổ thời gian giao dịch để tránh thời gian kém hiệu quả
- Chỉ số cảm xúc thị trường: tích hợp các chỉ số cảm xúc thị trường để tăng độ chính xác dự báo
Tóm tắt
Đây là một chiến lược tổng hợp được thiết kế hợp lý, logic đầy đủ. Bằng cách phối hợp nhiều chỉ số và chuyển đổi mô hình, có thể duy trì một số khả năng thích ứng trong các môi trường thị trường khác nhau. Mặc dù có một số rủi ro tiềm ẩn, nhưng với kiểm soát rủi ro hợp lý và tối ưu hóa liên tục, chiến lược có giá trị ứng dụng thực tế tốt.
- 1