Chiến lược giao dịch xu hướng thích ứng tích hợp đa chỉ báo

Tổng quan
Chiến lược này là một hệ thống giao dịch theo xu hướng thích ứng kết hợp nhiều chỉ báo kỹ thuật. Nó kết hợp hệ thống đường trung bình động (EMA), chỉ báo động lượng (RSI), chỉ báo xu hướng (MACD) và SuperTrend để xác nhận tín hiệu, đồng thời được trang bị cơ chế quản lý rủi ro hoàn chỉnh bao gồm các chức năng cắt lỗ, chốt lời và trailing stop. Thiết kế chiến lược xem xét đầy đủ tính biến động của thị trường, thông qua việc lọc nhiều tín hiệu và kiểm soát rủi ro nhằm nâng cao tính ổn định và độ tin cậy của giao dịch.
Nguyên lý chiến lược
Chiến lược áp dụng cơ chế xác nhận tín hiệu đa lớp:
- Xác định hướng xu hướng ban đầu thông qua sự giao nhau của EMA 9 và 21 kỳ
- Sử dụng RSI (14) để lọc quá mua/quá bán, tín hiệu mua yêu cầu RSI > 40 và < 70, tín hiệu bán yêu cầu RSI < 60 và > 30
- Chỉ báo MACD xác minh động lượng xu hướng, yêu cầu đường tín hiệu và đường MACD cùng hướng
- Chỉ báo SuperTrend cung cấp xác nhận xu hướng bổ sung
- Kiểm soát rủi ro sử dụng cắt lỗ 5%, chốt lời 10%, trailing stop 2% và điểm hòa vốn 1%
Chỉ khi tất cả các điều kiện đồng thời được thỏa mãn thì tín hiệu giao dịch mới được kích hoạt, giúp giảm hiệu quả rủi ro phá vỡ giả.
Lợi thế của chiến lược
- Cơ chế xác nhận đa tín hiệu làm giảm đáng kể nhiễu tín hiệu giả
- Hệ thống kiểm soát rủi ro hoàn chỉnh, bao gồm cắt lỗ cố định, trailing stop và cắt lỗ hòa vốn
- Chiến lược có khả năng thích ứng tốt, có thể thích ứng với các môi trường thị trường khác nhau
- Logic vào lệnh và thoát lệnh rõ ràng, dễ hiểu và dễ bảo trì
- Logic giao dịch có nền tảng lý thuyết vững chắc, mỗi chỉ báo đều có chức năng cụ thể
Rủi ro của chiến lược
- Cơ chế xác nhận đa tín hiệu có thể khiến bỏ lỡ một số cơ hội giao dịch quan trọng
- Trong thị trường biến động mạnh, mức cắt lỗ cố định có thể không linh hoạt
- Tối ưu hóa tham số có thể dẫn đến quá khớp với dữ liệu lịch sử
- Nhiều chỉ báo có thể tạo ra tín hiệu gây nhiễu trong thị trường đi ngang
Giải pháp bao gồm: điều chỉnh tham số cắt lỗ linh hoạt, đưa vào chỉ báo biến động, định kỳ tối ưu hóa lại tham số, v.v.
Hướng tối ưu hóa chiến lược
- Đưa vào cơ chế tham số thích ứng, điều chỉnh động các tham số khác nhau dựa trên biến động thị trường
- Thêm chỉ báo khối lượng làm công cụ xác nhận phụ trợ
- Tối ưu hóa cơ chế cắt lỗ, đưa vào cắt lỗ động dựa trên ATR
- Thêm mô-đun nhận dạng môi trường thị trường, sử dụng các bộ tham số khác nhau trong các điều kiện thị trường khác nhau
- Phát triển hệ thống tối ưu hóa tham số dựa trên máy học
Tổng kết
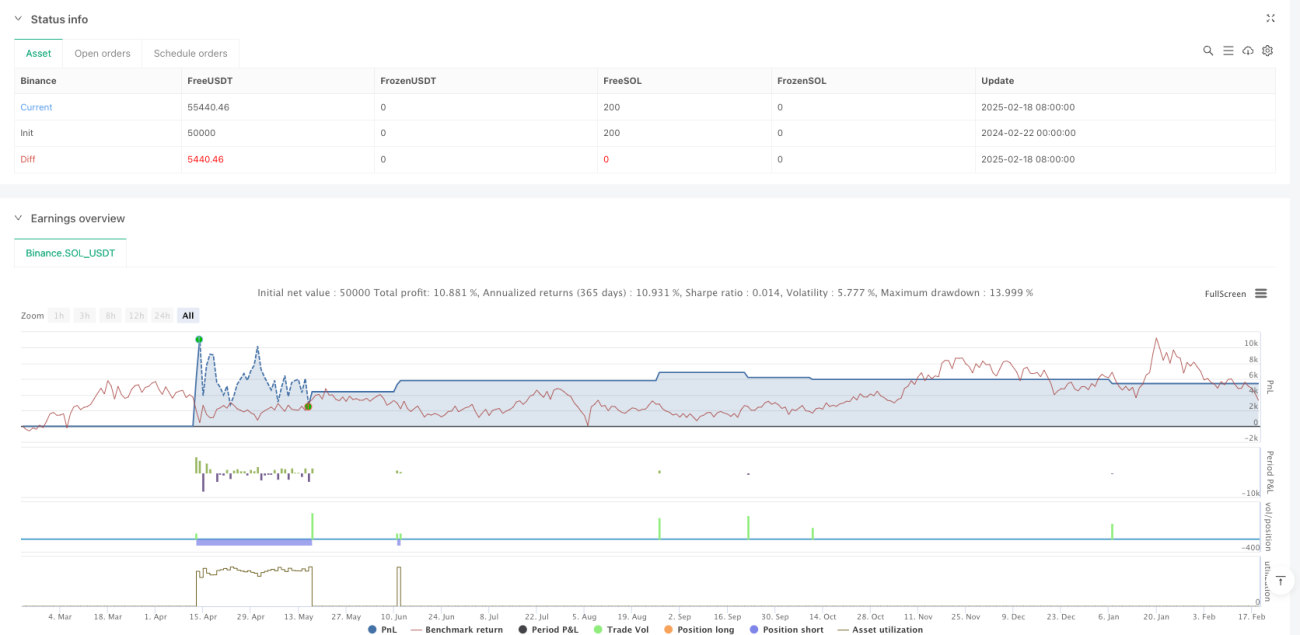
Chiến lược này xây dựng một hệ thống giao dịch vững chắc thông qua sự phối hợp của các chỉ báo kỹ thuật đa chiều. Cơ chế kiểm soát rủi ro hoàn chỉnh và logic giao dịch rõ ràng giúp nó có tính thực tiễn tốt. Mặc dù còn một số không gian tối ưu hóa nhất định, nhưng khung cơ bản của chiến lược có nền tảng lý thuyết vững chắc, thông qua việc tối ưu hóa và cải tiến liên tục, dự kiến có thể nâng cao hơn nữa hiệu quả giao dịch.
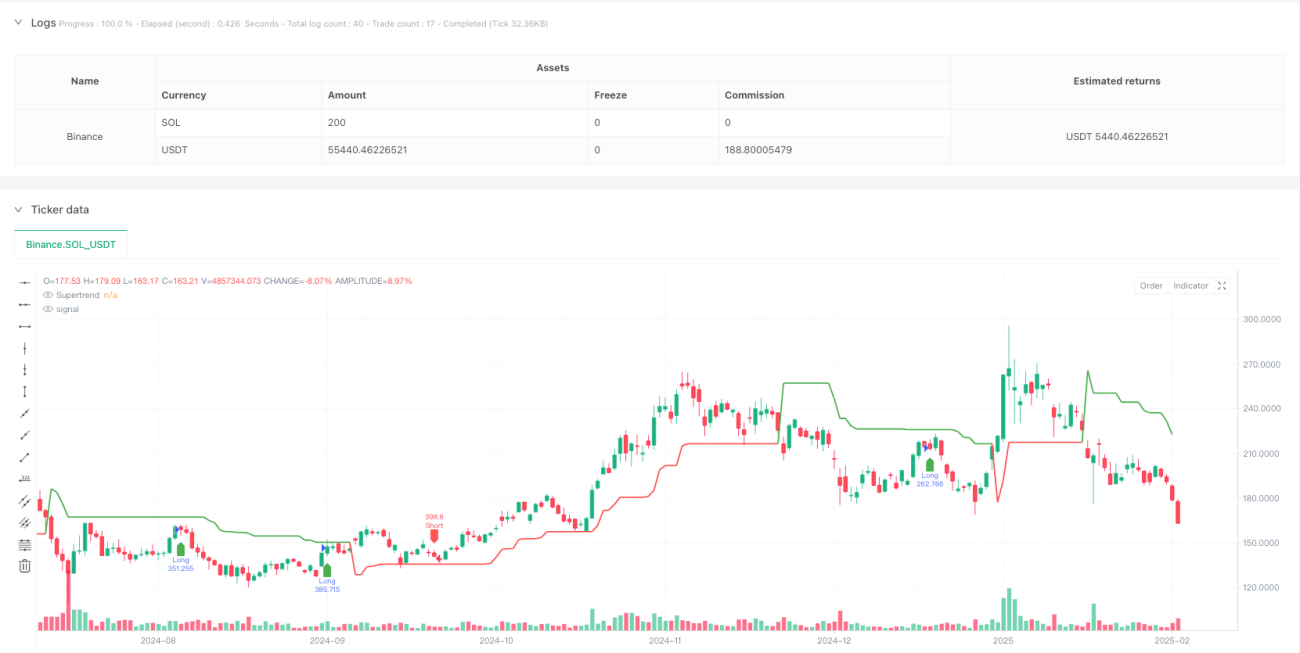
/*backtest
start: 2024-02-22 00:00:00
end: 2025-02-19 08:00:00
period: 1d
basePeriod: 1d
exchanges: [{"eid":"Binance","currency":"SOL_USDT"}]
*/

//@version=5
strategy("Optimized BTC Trading Strategy v2", overlay=true, default_qty_type=strategy.percent_of_equity, default_qty_value=100, commission_type=strategy.commission.percent, commission_value=0.1)

// Input parameters- 1