Hệ thống giao dịch xu hướng thích ứng đa chiều thông minh

Tổng quan
Chiến lược này là một hệ thống giao dịch thông minh kết hợp nhiều chỉ số kỹ thuật để xác định cơ hội thị trường thông qua phân tích tổng hợp về khoảng cách giá trị công bằng (FVG), tín hiệu xu hướng và hành vi giá. Hệ thống sử dụng cơ chế chiến lược kép, kết hợp theo dõi xu hướng và đặc điểm giao dịch băng tần, để tối ưu hóa hiệu suất giao dịch thông qua quản lý vị trí vị trí động và cơ chế thoát đa chiều. Chiến lược này đặc biệt tập trung vào kiểm soát rủi ro, nâng cao chất lượng tín hiệu thông qua lọc tỷ lệ biến động và xác nhận khối lượng giao dịch.
Nguyên tắc chiến lược
Lập luận cốt lõi của chiến lược này dựa trên các khía cạnh sau:
- Nhận diện lỗ hổng FVG - Tìm kiếm cơ hội giao dịch tiềm năng bằng cách tính toán kích thước lỗ hổng giá
- Hệ thống xác nhận xu hướng - kết hợp đường trung bình 200 ngày, chỉ số SuperTrend và MACD để xác nhận xu hướng thị trường
- Chứng nhận tài chính thông minh - Sử dụng RSI để kích hoạt giao dịch với các điều kiện mua quá mức, bán quá mức, giao dịch bất thường và mô hình hành vi giá
- Quản lý vị trí động - Điều chỉnh kích thước vị trí dựa trên ATR để đảm bảo tính nhất quán của lỗ hổng rủi ro
- Cơ chế thoát nhiều cấp - Quản lý thoát giao dịch bằng cách kết hợp tracking stop loss và target stop loss
Lợi thế chiến lược
- Khả năng thích ứng - Chiến lược có thể tự động điều chỉnh các tham số và vị trí tùy theo biến động của thị trường
- Kiểm soát rủi ro hoàn hảo - Kiểm soát rủi ro thông qua nhiều bộ lọc và quản lý vị trí nghiêm ngặt
- Chất lượng tín hiệu đáng tin cậy - tăng độ chính xác của tín hiệu giao dịch thông qua xác nhận chỉ số đa chiều
- Cách giao dịch linh hoạt - nắm bắt cả xu hướng và cơ hội của biến động
- Khoa học Quản lý Tài chính - Sử dụng Quản lý Rủi ro Tỷ lệ phần trăm để đảm bảo tính hợp lý của việc sử dụng tài chính
Rủi ro chiến lược
- Nhận thức tham số - thiết lập nhiều tham số có thể ảnh hưởng đến hiệu suất của chiến lược và cần được tối ưu hóa liên tục
- Tùy thuộc vào môi trường thị trường - có thể có tín hiệu đột phá giả trong một số môi trường thị trường
- Ảnh hưởng của điểm trượt - có thể có điểm trượt lớn hơn trong thị trường ít thanh khoản hơn
- Tính phức tạp tính toán - tính toán nhiều chỉ số có thể gây ra sự chậm trễ tín hiệu
- Yêu cầu vốn cao - Chiến lược thực hiện đầy đủ đòi hỏi quy mô vốn ban đầu lớn
Hướng tối ưu hóa chiến lược
- Tối ưu hóa trọng số chỉ số - có thể giới thiệu phương pháp học máy để điều chỉnh động trọng số của từng chỉ số
- Tăng khả năng thích ứng của thị trường - Cơ chế tự thích ứng tăng biến động thị trường
- Cải thiện bộ lọc tín hiệu - giới thiệu thêm các chỉ số cấu trúc vi mô thị trường
- Tối ưu hóa cơ chế thực hiện - Tăng cơ chế phân chia đơn đặt hàng thông minh để giảm chi phí tác động
- Nâng cấp kiểm soát rủi ro - tăng hệ thống quản lý ngân sách rủi ro động
Tóm tắt
Chiến lược này xây dựng một hệ thống giao dịch hoàn chỉnh bằng cách sử dụng tổng hợp nhiều chỉ số kỹ thuật và kỹ thuật giao dịch. Ưu điểm của nó là có thể thích ứng với sự thay đổi của thị trường, trong khi vẫn giữ được kiểm soát rủi ro nghiêm ngặt. Mặc dù có một số không gian tối ưu hóa, nhưng nói chung là một chiến lược giao dịch định lượng được thiết kế hợp lý.
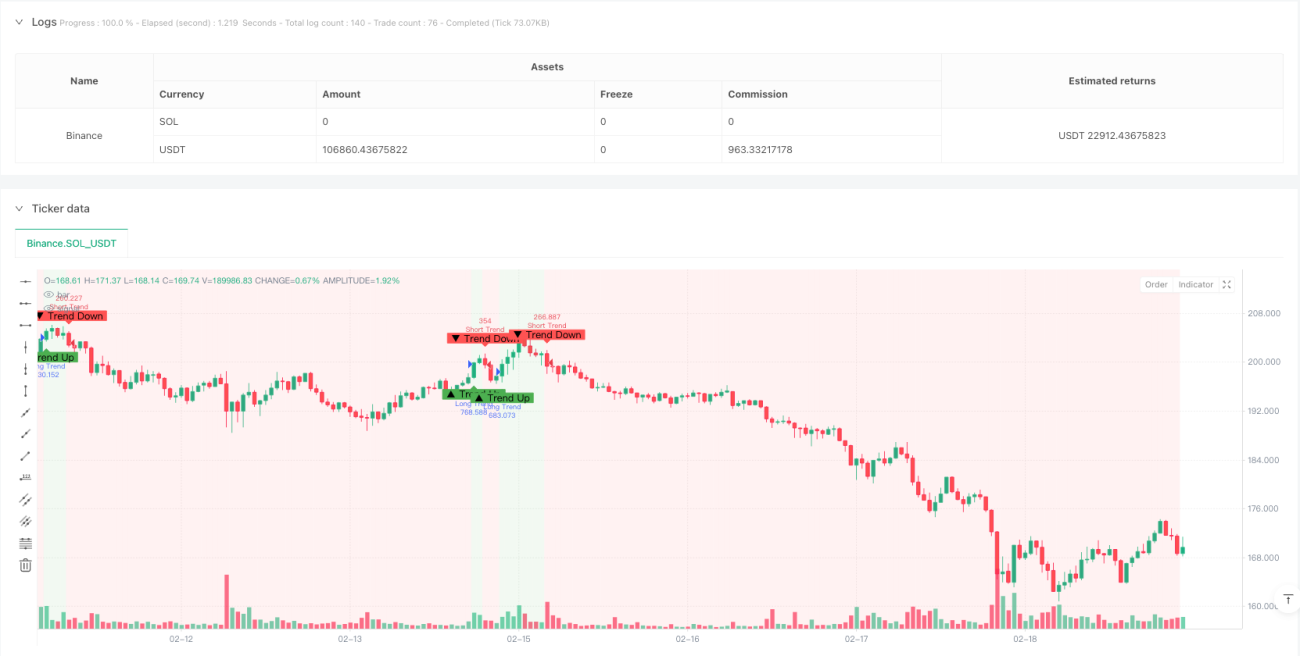
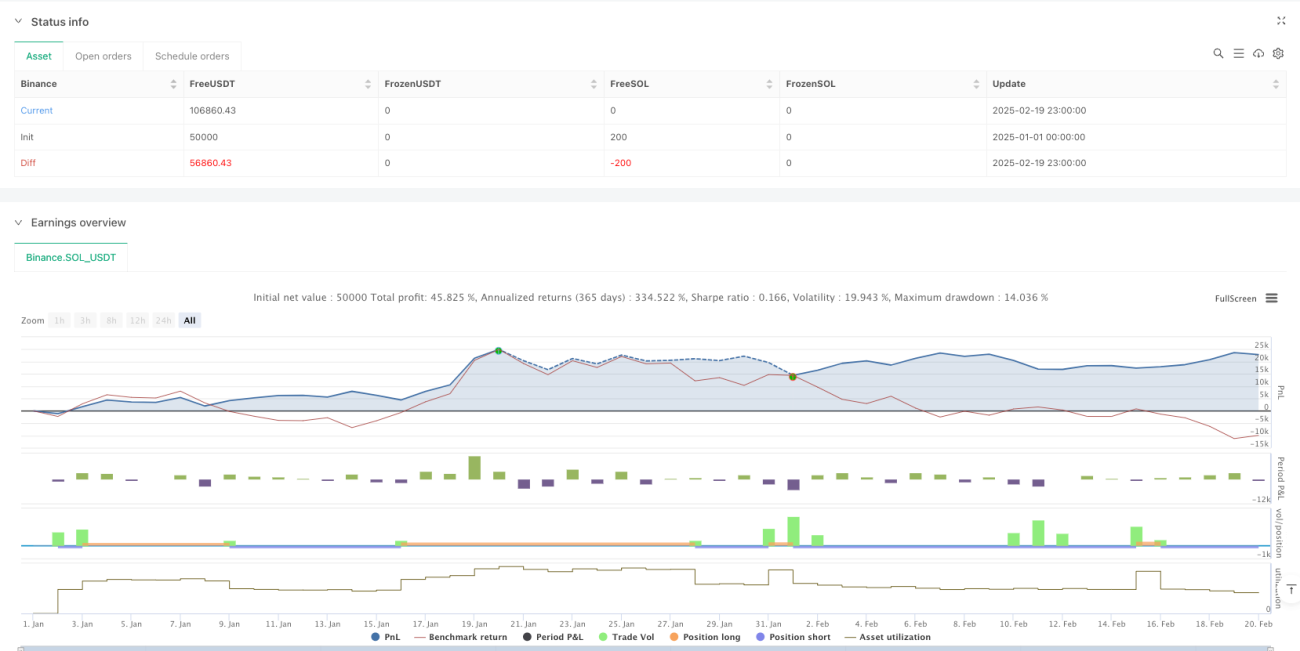
/*backtest
start: 2025-01-01 00:00:00
end: 2025-02-20 00:00:00
period: 1h
basePeriod: 1h
exchanges: [{"eid":"Binance","currency":"SOL_USDT"}]
*/

//@version=6
strategy("Adaptive Trend Signals", overlay=true, margin_long=100, margin_short=100, pyramiding=1, initial_capital=50000, default_qty_type=strategy.percent_of_equity, default_qty_value=100, commission_type=strategy.commission.percent, commission_value=0.075)

// 1. Enhanced Inputs with Debugging Options- 1