
Tổng quan
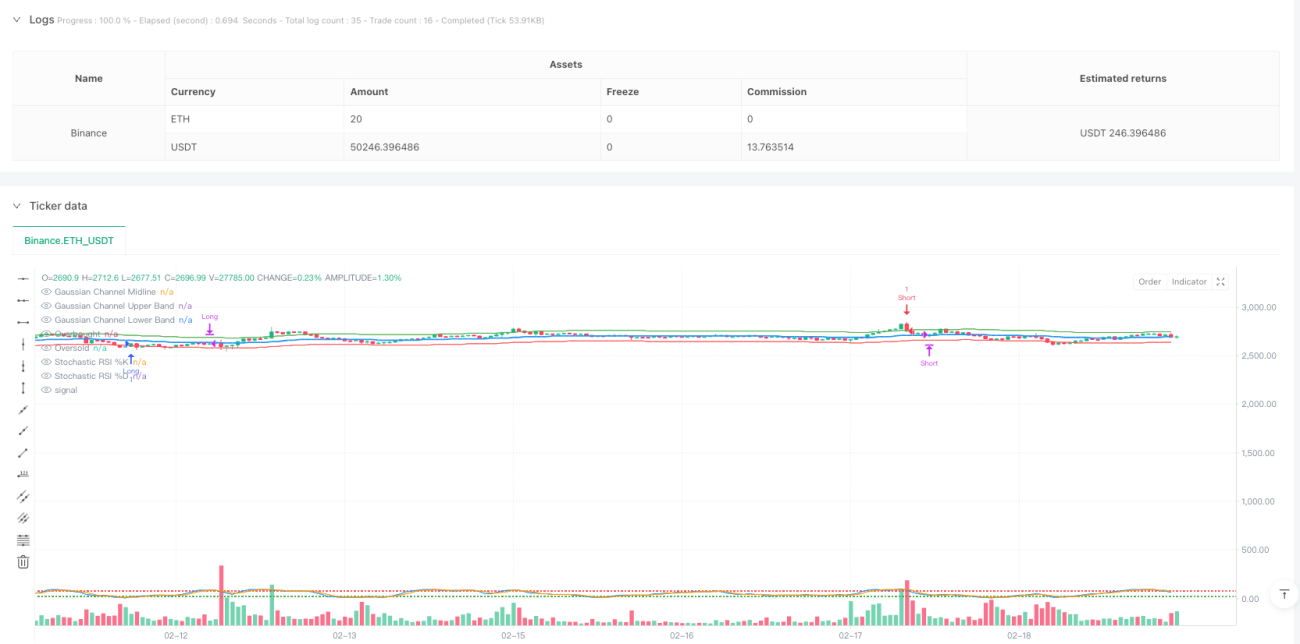
Chiến lược này là một hệ thống giao dịch theo dõi xu hướng kết hợp Gaussian Channel và chỉ số tương đối mạnh ngẫu nhiên (Stochastic RSI). Gaussian Channel được sử dụng để xác định xu hướng giá và phạm vi biến động, trong khi Stochastic RSI hoạt động như một bộ lọc để xác nhận các điều kiện mua quá mức, do đó cải thiện độ chính xác của tín hiệu giao dịch. Chiến lược này tạo ra tín hiệu giao dịch bằng cách quan sát giá giao nhau với biên giới Gaussian Channel và vị trí của Stochastic RSI.
Nguyên tắc chiến lược
Logic cốt lõi của chiến lược này dựa trên các thành phần chính sau:
- Tính kênh Gauss: Sử dụng bộ lọc Gauss để tính đường trung bình và dựa trên cài đặt nhân của dải kênh lên xuống. Bộ lọc Gauss sử dụng phương pháp làm mịn chỉ số, có thể làm giảm hiệu quả tiếng ồn giá.
- Stochastic RSI: kết hợp lợi thế của chỉ số ngẫu nhiên và RSI để xác định tình trạng quá mua và quá bán thông qua hai đường trơn %K và %D.
- Điều kiện tham gia:
- Nhiều đầu: Giá phá vỡ đường Gaussian và Stochastic RSI ở khu vực bán tháo
- Bottom: Giá giảm trên đường Gaussian và Stochastic RSI ở vùng quá mua
- Điều kiện:
- Khi giá vượt qua đường trung bình của đường Gaussian
- Hoặc Stochastic RSI đạt mức bán tháo trái ngược
Lợi thế chiến lược
- Tín hiệu đáng tin cậy cao: kết hợp xu hướng và động lực, có thể lọc hiệu quả các tín hiệu giả
- Kiểm soát rủi ro hoàn hảo: Sử dụng kênh Gauss như một điểm áp lực hỗ trợ động, cung cấp một khuôn khổ quản lý rủi ro tốt
- Các tham số có thể điều chỉnh: có thể điều chỉnh chiều rộng kênh và tham số RSI theo các đặc điểm thị trường khác nhau
- Hiệu quả tính toán cao: Bộ lọc Gaussian có khối lượng tính toán nhỏ, phù hợp với giao dịch trực tiếp
- Khả năng thích ứng: có thể được sử dụng trong các chu kỳ thời gian khác nhau và môi trường thị trường
Rủi ro chiến lược
- Rủi ro thị trường chấn động: Có thể xảy ra các tín hiệu phá vỡ sai lệch thường xuyên trên thị trường ngang
- Rủi ro về sự chậm trễ: xử lý trơn tru chỉ số có thể gây ra sự chậm trễ tín hiệu
- Tính nhạy cảm của tham số: sự kết hợp các tham số khác nhau có thể dẫn đến kết quả giao dịch khác nhau đáng kể
- Tùy thuộc vào môi trường thị trường: hoạt động tốt hơn trong thị trường xu hướng mạnh, nhưng có thể có sự rút lui lớn hơn trong thị trường đảo ngược nhanh
Hướng tối ưu hóa chiến lược
- Tối ưu hóa tham số động:
- Chuyển đổi chiều rộng theo biến động thị trường
- Định mức RSI Stochastic dựa trên các đặc điểm của chu kỳ thị trường
- Cơ chế xác nhận tín hiệu:
- Thêm chỉ số xác nhận giao dịch
- Tiếp theo là một bộ lọc cường độ xu hướng.
- Tăng cường quản lý rủi ro:
- Thực hiện dừng lỗ động
- Tham gia vào mô-đun quản lý vị thế
- Xác định môi trường thị trường:
- Phát triển phân loại trạng thái thị trường
- Điều chỉnh các tham số chiến lược theo các tình trạng thị trường khác nhau
Tóm tắt
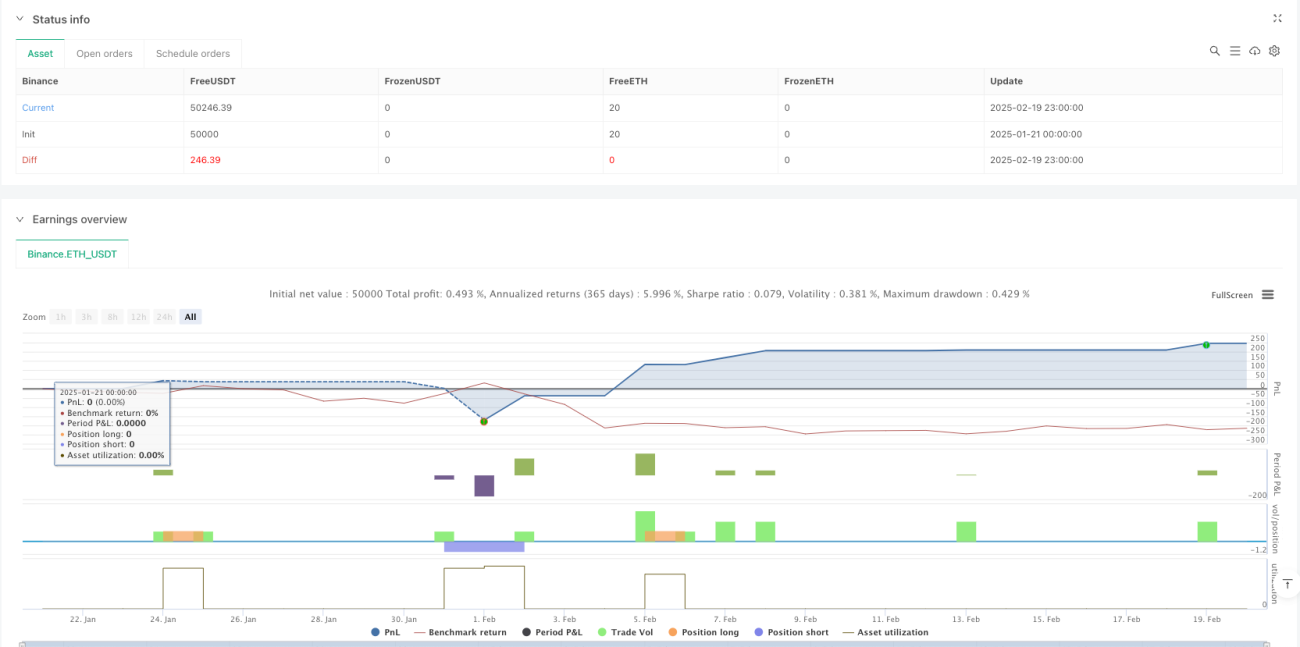
Chiến lược này kết hợp Gaussian Channel và Stochastic RSI để xây dựng một hệ thống giao dịch có tính năng theo dõi xu hướng và động lực. Chiến lược được thiết kế hợp lý, có khả năng mở rộng và thích ứng tốt. Bằng hướng tối ưu hóa được đề xuất, bạn có thể nâng cao hơn nữa sự ổn định và lợi nhuận của chiến lược.
- 1