
Tổng quan
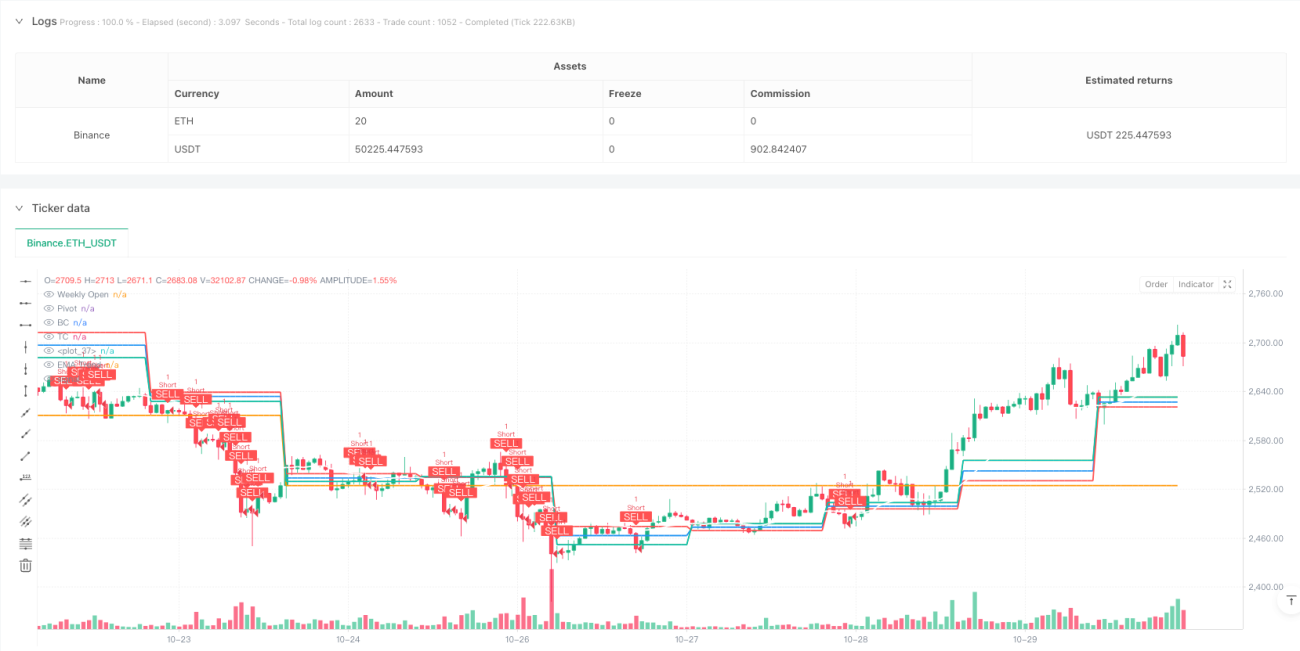
Chiến lược này là một hệ thống giao dịch dựa trên phân tích nhiều chu kỳ thời gian, chủ yếu sử dụng khoảng giá trung tâm (CPR), chỉ số di chuyển trung bình (EMA) và chỉ số tương đối mạnh (RSI) để giao dịch. Chiến lược này xác định xu hướng thị trường và các mức kháng cự hỗ trợ quan trọng thông qua mức CPR hàng ngày, giá mở cửa hàng tuần và 20 chu kỳ EMA và kết hợp xác nhận giao dịch để thực hiện giao dịch.
Nguyên tắc chiến lược
Trung tâm của chiến lược là tìm kiếm cơ hội giao dịch bằng cách phân tích mối quan hệ giữa giá và mức CPR. CPR bao gồm điểm trung tâm chính (Pivot), đường trung tâm dưới (BC) và đường trung tâm trên (TC). Khi giá vượt qua TC và thị trường ở giai đoạn nhiều đầu, hệ thống sẽ phát ra nhiều tín hiệu; Khi giá giảm xuống BC và thị trường ở giai đoạn trống, hệ thống sẽ phát ra tín hiệu trống.
Lợi thế chiến lược
- Cơ chế xác nhận nhiều lần: kết hợp hành vi giá, hướng xu hướng và xác nhận ba lần khối lượng giao dịch, nâng cao độ tin cậy của tín hiệu giao dịch
- Quản lý rủi ro động: Đặt dừng động dựa trên chiều rộng CPR, thích ứng với các môi trường thị trường khác nhau
- Tùy chọn tùy chỉnh linh hoạt: có thể điều chỉnh chu kỳ thời gian CPR, độ dài EMA và bật / tắt xác nhận lệch RSI
- Tỷ lệ lợi nhuận không đối xứng: sử dụng tỷ lệ lợi nhuận rủi ro 1.5:1 để tăng lợi nhuận dài hạn
- Phân tích đa chu kỳ: cung cấp cái nhìn toàn diện hơn về thị trường bằng cách tích hợp dữ liệu đường nét và đường quay
Rủi ro chiến lược
- Rủi ro phá vỡ giả: Có thể có tín hiệu phá vỡ giả trong thị trường biến động, nên sử dụng các điều kiện lọc khối lượng giao dịch nghiêm ngặt hơn
- Rủi ro đảo ngược xu hướng: có thể có sự rút lui lớn hơn tại các điểm biến đổi xu hướng, có thể kiểm soát rủi ro bằng cách thu hẹp phạm vi dừng
- Tính nhạy cảm của tham số: hiệu suất chiến lược nhạy cảm với các tham số như độ dài EMA và giá trị giao dịch, cần được tối ưu hóa thường xuyên
- Phụ thuộc vào môi trường thị trường: Tỷ lệ rủi ro lợi nhuận dự kiến có thể khó đạt được trong môi trường biến động thấp
- Điểm trượt thực hiện: Có thể gặp điểm trượt lớn hơn trong điều kiện nhanh, ảnh hưởng đến hiệu quả giao dịch thực tế
Hướng tối ưu hóa chiến lược
- Tiếp tục áp dụng cơ chế tự điều chỉnh biến động: điều chỉnh mục tiêu dừng lỗ và lợi nhuận theo biến động của thị trường
- Tăng phân loại tình trạng thị trường: phân khúc xu hướng và tổng hợp thị trường, sử dụng các tham số giao dịch khác nhau
- Tối ưu hóa bộ lọc khối lượng giao dịch: xem xét sự thay đổi khối lượng giao dịch tương đối thay vì so sánh đường trung bình đơn giản
- Cải thiện cơ chế ra sân: tăng tính năng dừng lỗ di động và kết thúc một phần lợi nhuận
- Thêm bộ lọc thời gian: tránh giao dịch trong một khoảng thời gian nhất định, chẳng hạn như các giai đoạn biến động cao trước và sau khi thị trường mở cửa
Tóm tắt
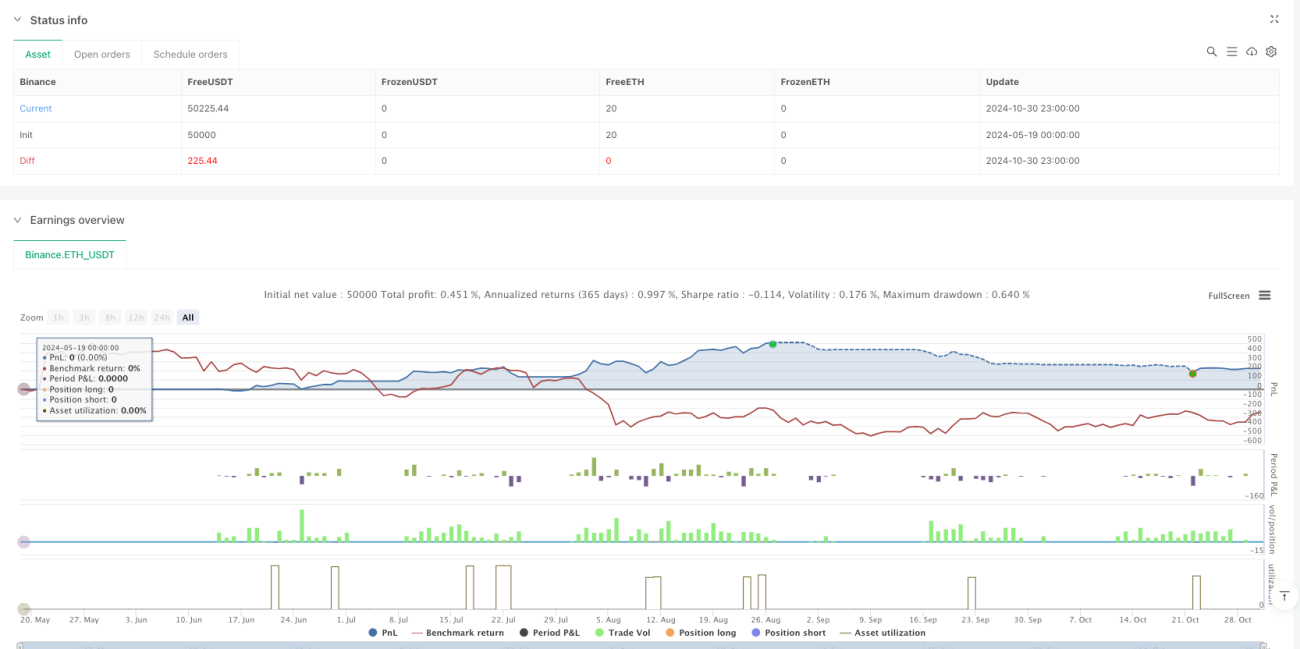
Đây là một chiến lược theo dõi xu hướng có cấu trúc, logic rõ ràng, kiểm soát rủi ro giao dịch một cách hiệu quả thông qua việc sử dụng nhiều chỉ số kỹ thuật. Ưu điểm chính của chiến lược là thiết lập tham số linh hoạt và cơ chế quản lý rủi ro tốt, nhưng đồng thời cũng yêu cầu các nhà giao dịch chú ý đến sự thay đổi của môi trường thị trường và điều chỉnh các tham số chiến lược kịp thời.
//@version=5
strategy("Ahmad Ali Khan CPR Strategy", overlay=true, margin_long=100, margin_short=100)

// ———— Inputs ————
use_daily_cpr = input.bool(true, "Use Daily CPR Levels")
ema_length = input.int(20, "EMA Trend Filter Length")
show_week_open = input.bool(true, "Show Weekly Open Price")
enable_divergence = input.bool(true, "Enable RSI Divergence Check")

// ———— Daily CPR Calculation ————
daily_high = request.security(syminfo.tickerid, "D", high[1], lookahead=barmerge.lookahead_on)
daily_low = request.security(syminfo.tickerid, "D", low[1], lookahead=barmerge.lookahead_on)- 1