
Tổng quan
Chiến lược này là một hệ thống giao dịch theo dõi xu hướng dựa trên sự phá vỡ của kênh Donchian, kết hợp các chỉ số siêu xu hướng và bộ lọc khối lượng giao dịch để tăng cường độ tin cậy của tín hiệu giao dịch. Chiến lược này chủ yếu xác định các cơ hội giao dịch đa đầu tiềm năng bằng cách nắm bắt mức giá phá vỡ mức cao lịch sử, đồng thời sử dụng xác nhận khối lượng giao dịch và các chỉ số theo dõi xu hướng để lọc các tín hiệu phá vỡ giả.
Nguyên tắc chiến lược
Logic cốt lõi của chiến lược này dựa trên các thành phần chính sau:
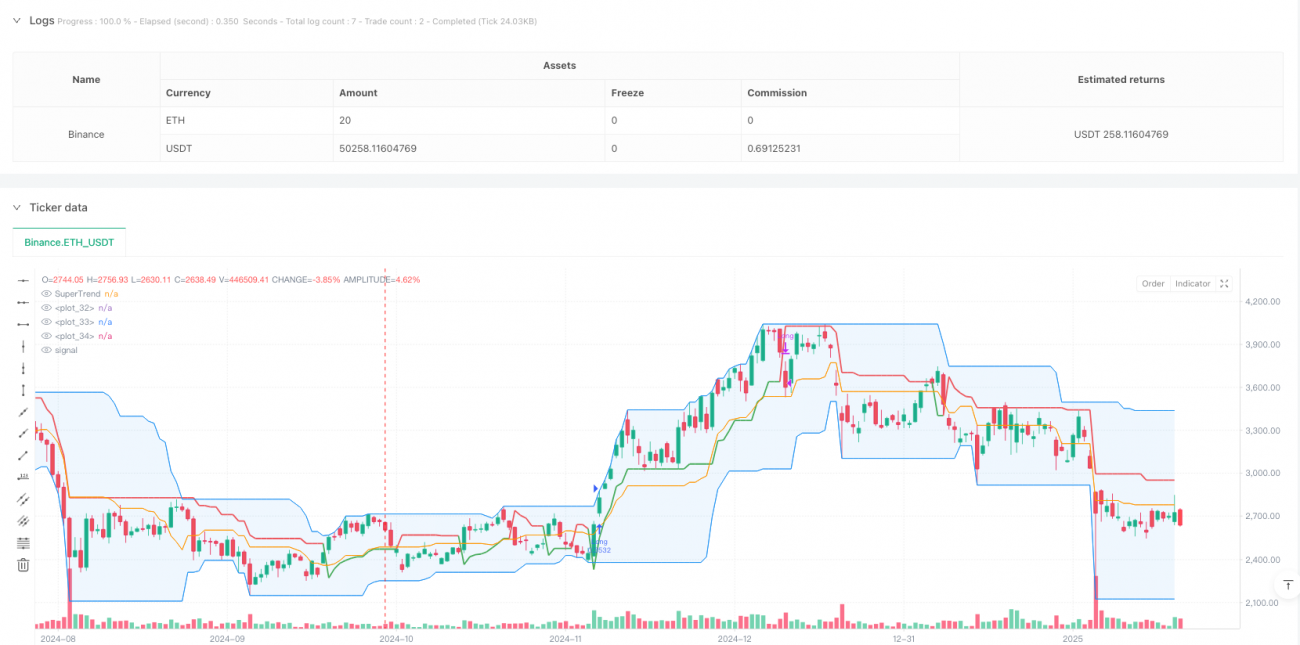
- Đường Dongxian: tính giá cao nhất và giá thấp nhất trong chu kỳ do người dùng xác định, tạo ra đường lên, đường xuống và đường giữa. Khi giá phá vỡ đường lên, kích hoạt tín hiệu nhập cảnh đa đầu.
- Bộ lọc khối lượng giao dịch: Bằng cách so sánh khối lượng giao dịch hiện tại với trung bình di chuyển 20 chu kỳ, đảm bảo chỉ tham gia khi khối lượng giao dịch tăng lên, tăng độ tin cậy của đột phá.
- Chỉ số xu hướng siêu: Là một công cụ xác nhận xu hướng, nó hiển thị màu xanh lá cây khi xu hướng đa đầu, và màu đỏ khi xu hướng không đầu.
- Cơ chế dừng linh hoạt: cung cấp bốn tùy chọn dừng khác nhau, bao gồm dừng dưới đường ray, dừng giữa đường ray, dừng siêu xu hướng và dừng theo dõi phần trăm.
Lợi thế chiến lược
- Xác nhận đa tín hiệu: kết hợp với giá phá vỡ, xác nhận khối lượng giao dịch và chỉ số xu hướng, giảm đáng kể nguy cơ phá vỡ giả.
- Khả năng thích ứng: Có thể thích ứng với các môi trường thị trường khác nhau và chu kỳ giao dịch thông qua điều chỉnh tham số.
- Quản lý rủi ro tốt: cung cấp nhiều lựa chọn dừng lỗ, có thể chọn cách dừng lỗ phù hợp nhất theo đặc điểm của thị trường.
- Hiển thị rõ ràng: giao diện chiến lược hiển thị các chỉ số trực quan, giúp thương nhân hiểu được tình trạng thị trường.
- Tính linh hoạt: cho phép tùy chỉnh phạm vi thời gian phản hồi để tối ưu hóa chiến lược.
Rủi ro chiến lược
- Rủi ro của thị trường chấn động: có thể tạo ra các tín hiệu phá vỡ giả thường xuyên trong các biến động trong khu vực.
- Rủi ro trượt: Trong thị trường ít lưu động, tín hiệu phá vỡ có thể dẫn đến sự lệch giá nhập cảnh do trượt.
- Rủi ro bị quá tải: Chạy lọc khối lượng giao dịch có thể sẽ bỏ lỡ một số cơ hội giao dịch hiệu quả.
- Độ nhạy của tham số: Hiệu ứng của chiến lược nhạy cảm với các cài đặt tham số và đòi hỏi phải tối ưu hóa cẩn thận.
Hướng tối ưu hóa chiến lược
- Thêm bộ lọc cường độ xu hướng: Bạn có thể thêm các chỉ số cường độ xu hướng như ADX, chỉ tham gia khi xu hướng mạnh.
- Tối ưu hóa các chỉ số giao dịch: Bạn có thể xem xét sử dụng các chỉ số giao dịch tương đối hoặc giao dịch đột phá thay vì chỉ số trung bình di chuyển đơn giản.
- Thêm bộ lọc thời gian: Thêm cài đặt cửa sổ thời gian giao dịch, tránh thời gian thị trường biến động lớn.
- Tối ưu hóa tham số động: Tự động điều chỉnh chu kỳ kênh và tham số siêu xu hướng theo biến động của thị trường.
- Tham gia học máy: Tối ưu hóa lựa chọn tham số và lọc tín hiệu bằng thuật toán học máy.
Tóm tắt
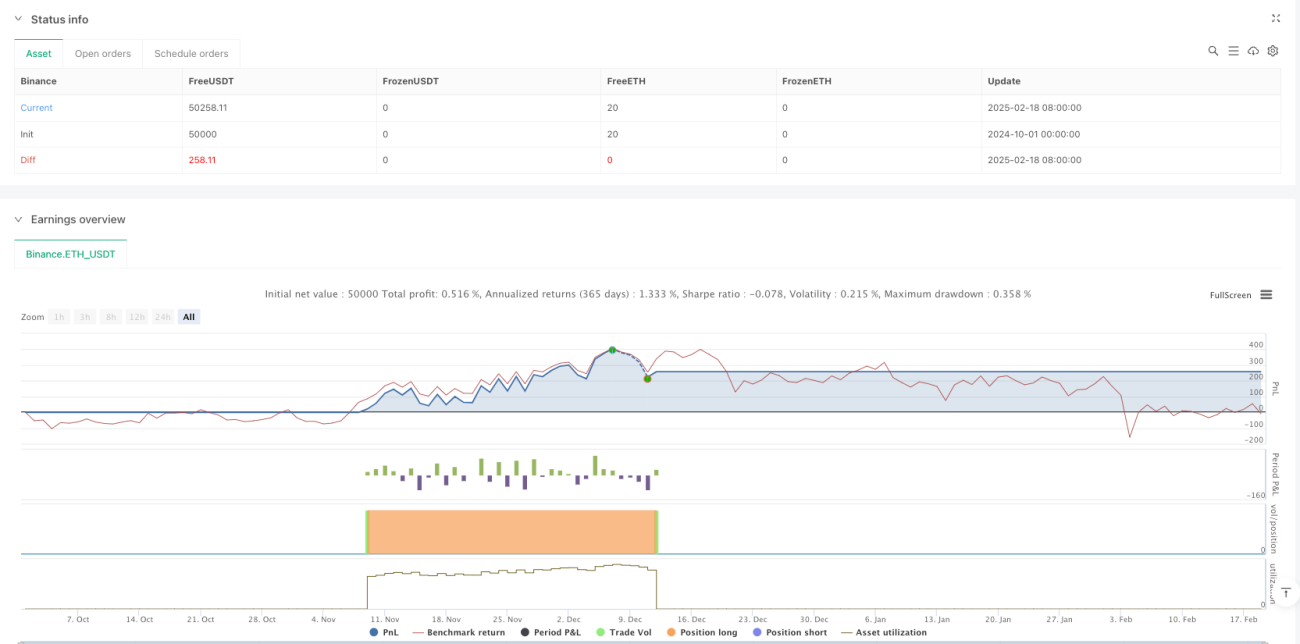
Chiến lược này xây dựng một hệ thống giao dịch theo dõi xu hướng tương đối hoàn hảo bằng cách sử dụng tổng hợp nhiều chỉ số kỹ thuật. Ưu điểm của chiến lược là tín hiệu đáng tin cậy cao, khả năng quản lý rủi ro linh hoạt, nhưng vẫn yêu cầu các nhà giao dịch tối ưu hóa các tham số theo đặc điểm thị trường cụ thể. Bằng cách cải tiến và tối ưu hóa liên tục, chiến lược này có thể đạt được hiệu quả giao dịch ổn định trong thị trường xu hướng.
- 1