Đột phá năng động của Đường xu hướng nêm giảm Chiến lược giao dịch định lượng

Tổng quan
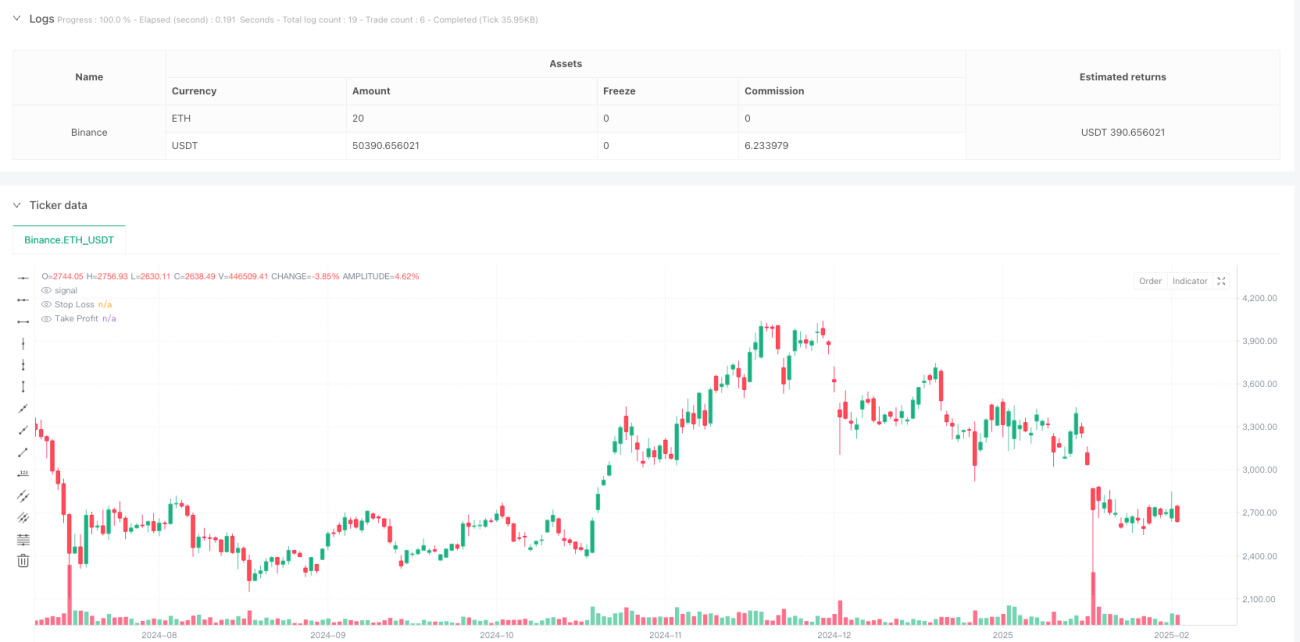
Chiến lược này là một hệ thống giao dịch phá vỡ xu hướng dựa trên hình dạng hình thức giảm trong phân tích kỹ thuật. Nó xây dựng đường xu hướng lên xuống bằng cách động xác định các điểm cao và thấp trong giá, vào vị trí đa đầu khi giá phá vỡ đường xu hướng. Chiến lược sử dụng cơ chế dừng lỗ động để kiểm soát rủi ro và khóa lợi nhuận. Đây là một thực hiện theo quy trình của phương pháp giao dịch phân tích kỹ thuật cổ điển, đặc biệt phù hợp để nắm bắt cơ hội đảo ngược khi xu hướng giảm sắp kết thúc.
Nguyên tắc chiến lược
Lập luận cốt lõi của chiến lược bao gồm các bước quan trọng sau:
- Sử dụng phương pháp Pivot để xác định động các điểm cao và thấp trong chuyển động giá
- Ghi lại và lưu giữ hai điểm cao và thấp gần đây nhất và chỉ số thời gian tương ứng
- Tính lệch của đường xu hướng lên xuống dựa trên các điểm này
- Xác định hình thành hình dạng giảm: yêu cầu hai điểm giảm cao, hai điểm giảm thấp và độ lệch đường xu hướng lên nhỏ hơn độ lệch đường xu hướng xuống
- Khi giá phá vỡ đường xu hướng, kích hoạt tín hiệu mua
- Thiết lập điều kiện dừng lỗ phần trăm dựa trên giá khởi điểm
Lợi thế chiến lược
- Khả năng nhận dạng cấu trúc thị trường: Chiến lược có thể tự động nhận diện các điểm quan trọng trong cấu trúc giá mà không cần sự can thiệp của con người
- Trend reversal capture: tập trung vào việc nắm bắt các cơ hội tiềm năng để đảo ngược xu hướng giảm, thường là cơ hội giao dịch có lợi nhuận cao hơn so với rủi ro
- Tạo tín hiệu chính xác: tính toán chính xác vị trí đường xu hướng và điểm phá vỡ bằng phương pháp toán học
- Quản lý rủi ro hoàn hảo: bao gồm các cơ chế dừng lỗ trước để kiểm soát hiệu quả rủi ro của mỗi giao dịch
- Hoạt động có hệ thống: chiến lược logic hoàn toàn có hệ thống, tránh sự can thiệp cảm xúc của con người
Rủi ro chiến lược
- Rủi ro đột phá giả: Thị trường có thể có đột phá giả, dẫn đến tín hiệu sai
- Độ nhạy của tham số: Hiệu ứng của chiến lược nhạy cảm với các cài đặt tham số và các môi trường thị trường khác nhau có thể yêu cầu điều chỉnh các tham số.
- Tùy thuộc vào điều kiện thị trường: Chiến lược có thể tạo ra quá nhiều tín hiệu sai trong thị trường biến động
- Rủi ro dừng lỗ: Sự biến động nhanh có thể dẫn đến giá dừng lỗ thực tế.
- Tác động chi phí giao dịch: giao dịch thường xuyên có thể dẫn đến chi phí giao dịch cao hơn
Hướng tối ưu hóa chiến lược
- Cơ chế xác nhận tín hiệu: có thể thêm các chỉ số như khối lượng giao dịch, động lượng như xác nhận đột phá
- Tối ưu hóa tham số động: giới thiệu cơ chế thích ứng, điều chỉnh tham số theo biến động của thị trường
- Xác minh nhiều chu kỳ thời gian: tăng cơ chế xác nhận nhiều chu kỳ thời gian, tăng độ tin cậy tín hiệu
- Cải thiện Stop Loss: Có thể sử dụng Stop Loss động, chẳng hạn như Tracking Stop Loss
- Bộ lọc môi trường thị trường: thêm bộ lọc xu hướng, giao dịch trong môi trường thị trường phù hợp
Tóm tắt
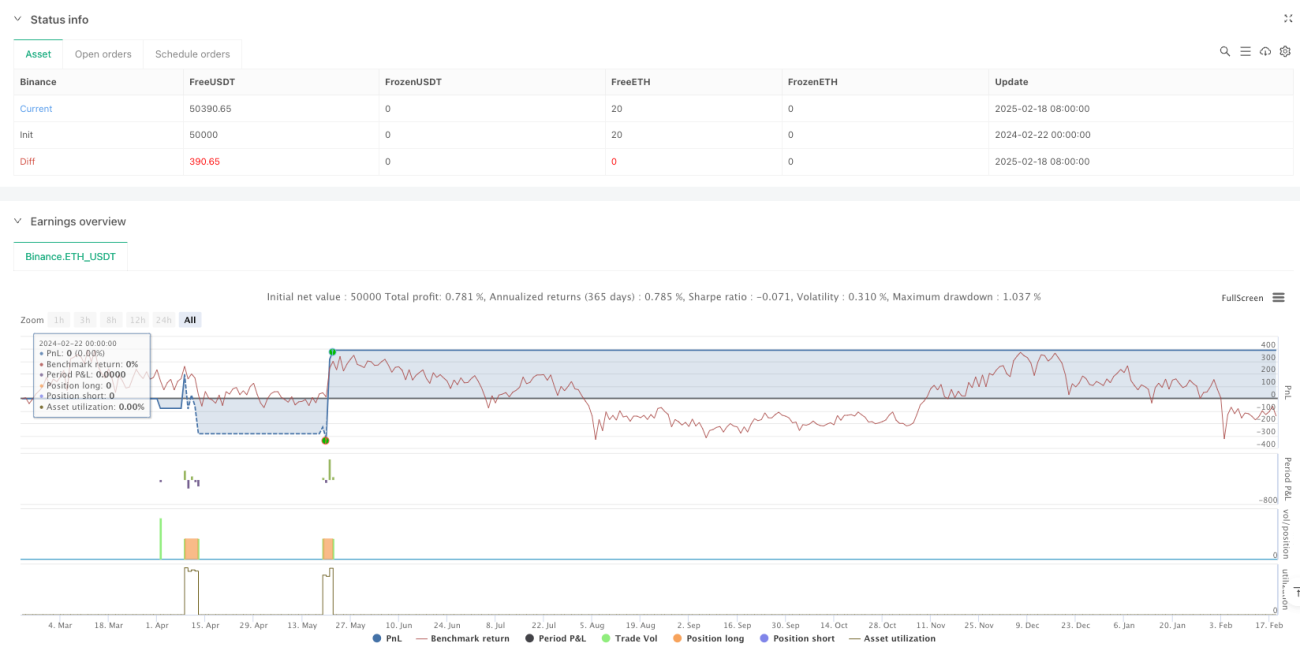
Đây là một chiến lược giao dịch xu hướng được thiết kế hợp lý, thực hiện các phương pháp phân tích kỹ thuật truyền thống bằng cách lập trình. Ưu điểm của chiến lược là có thể tự động xác định cấu trúc thị trường và nắm bắt các cơ hội đảo ngược xu hướng tiềm ẩn.
/*backtest
start: 2025-04-11 00:00:00
end: 2025-07-10 00:00:00
period: 10m
basePeriod: 10m
exchanges: [{"eid":"Binance","currency":"BTC_USDT","balance":200000}]
*/

// This Pine Script™ code is subject to the terms of the Mozilla Public License 2.0 at https://mozilla.org/MPL/2.0/

//@version=6
strategy("Falling Wedge Strategy by Nitin", overlay=true)- 1