
Tổng quan
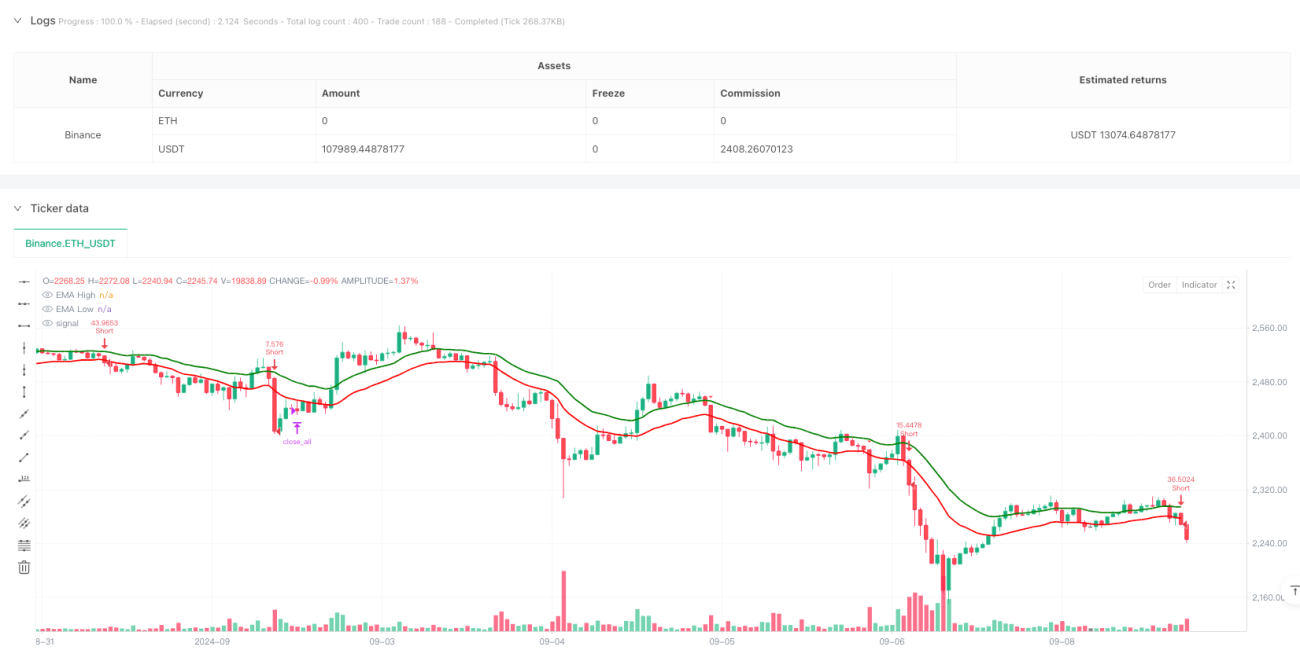
Đây là một chiến lược giao dịch trong ngày dựa trên nhiều chỉ số kỹ thuật, chủ yếu sử dụng các tín hiệu đa dạng như kênh EMA, RSI overbought and oversold, xác nhận xu hướng MACD để giao dịch. Chiến lược này hoạt động trên chu kỳ 3 phút, nắm bắt xu hướng thị trường thông qua đường quỹ đạo EMA cao và thấp kết hợp xác nhận chéo của RSI và MACD, và thiết lập một lệnh dừng lỗ động dựa trên ATR, và thời gian đóng cửa cố định.
Nguyên tắc chiến lược
Chiến lược sử dụng 20 chu kỳ EMA để tính toán giá cao nhất và giá thấp nhất để tạo ra một kênh, khi giá vượt qua kênh và đáp ứng các điều kiện sau:
- Nhiều đầu vào: Đi qua đường cao EMA trên giá đóng cửa, RSI trong khoảng 50-70 và đường MACD trên đường tín hiệu
- Bước vào đầu không: Đi qua đường EMA thấp dưới giá đóng cửa, RSI nằm trong khoảng 30-50, MACD đi qua đường tín hiệu
- Sử dụng ATR động để tính toán vị trí dừng lỗ, đặt điểm dừng theo tỷ lệ lợi nhuận rủi ro gấp 2,5 lần
- Mỗi giao dịch có rủi ro 1% cho tài khoản, kích thước vị trí được tính theo chiều dài dừng lỗ động
- Tất cả các vị trí bắt buộc phải đóng cửa vào lúc 15:00 giờ Ấn Độ.
Lợi thế chiến lược
- Xác thực chéo các chỉ số kỹ thuật đa dạng để tăng độ tin cậy tín hiệu giao dịch
- Động thái dừng lỗ dựa trên chỉ số ATR để thích ứng tốt hơn với biến động thị trường
- Tỷ lệ rủi ro cố định và tỷ lệ lợi nhuận rủi ro, kiểm soát rủi ro hiệu quả
- Xét chi phí giao dịch, bao gồm tính phí xử lý
- Cấm đặt cược đồng phương để tránh rủi ro quá mức
- Đặt thời gian đóng cửa để tránh rủi ro qua đêm
Rủi ro chiến lược
- Nhiều chỉ số có thể làm chậm tín hiệu và ảnh hưởng đến thời gian nhập cảnh
- Đường EMA có thể tạo ra các đột phá giả thường xuyên trên thị trường ngang
- Tỷ lệ lợi nhuận rủi ro cố định có thể không đủ linh hoạt trong các môi trường thị trường khác nhau
- RSI có thể bỏ lỡ một số xu hướng lớn
- Các nhà đầu tư có thể bị buộc phải rút ra khỏi các vị trí quan trọng khi họ buộc phải đóng cửa.
Hướng tối ưu hóa chiến lược
- Xem xét tăng chỉ số giao dịch như một xác nhận phụ trợ
- Tỷ lệ lợi nhuận rủi ro có thể được điều chỉnh theo động lực của các tính năng biến động trong các giai đoạn khác nhau
- Tiến hành đợt điều chỉnh động của RSI
- Xem xét tăng cường độ xu hướng bộ lọc giảm đột phá giả
- Bạn có thể xem xét điều chỉnh các tham số tùy thuộc vào các đặc điểm của thời gian trong ngày
- Thêm phân tích biến động lịch sử để tối ưu hóa quản lý vị trí
Tóm tắt
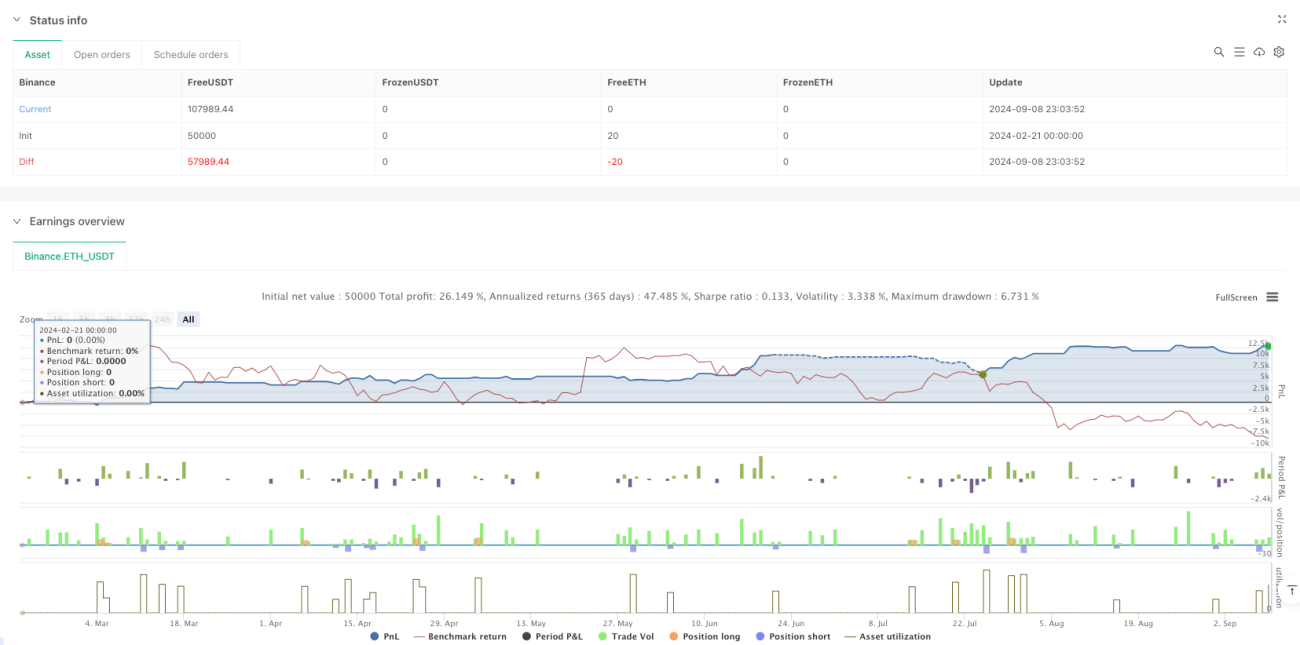
Chiến lược này xây dựng một hệ thống giao dịch tương đối hoàn chỉnh bằng cách sử dụng kết hợp nhiều chỉ số kỹ thuật. Ưu điểm của chiến lược là kiểm soát rủi ro khá hoàn hảo, bao gồm các cơ chế như dừng động, rủi ro cố định và thanh toán. Mặc dù có một số rủi ro chậm trễ, nhưng có thể nâng cao hơn nữa hiệu suất của chiến lược bằng cách tối ưu hóa tham số và tăng các chỉ số phụ trợ.
- 1