Chiến lược đảo ngược nâng cao dựa trên RSI và khối lượng trong giao dịch định lượng

Tổng quan
Đây là một chiến lược giao dịch đảo ngược dựa trên chỉ số RSI và khối lượng giao dịch. Chiến lược này xác nhận khối lượng giao dịch bằng cách xác định trạng thái mua bán quá mức trong thị trường, kết hợp với xác nhận khối lượng giao dịch, và thực hiện giao dịch ngược khi giá xuất hiện ở trạng thái cực. Ý tưởng cốt lõi của chiến lược là giao dịch khi có tín hiệu mua hoặc bán quá mức trong chỉ số RSI và khối lượng giao dịch cao hơn mức trung bình, thông qua đường trung tâm RSI ((50) làm tín hiệu thoát.
Nguyên tắc chiến lược
Chiến lược này dựa trên các thành phần cốt lõi sau:
- Tính toán chỉ số RSI: sử dụng chỉ số RSI 14 chu kỳ để theo dõi động thái giá
- Xác nhận khối lượng giao dịch: sử dụng khối lượng giao dịch trung bình di chuyển 20 chu kỳ (SMA)
- Logic nhập cảnh:
- Nhiều đầu vào: khi RSI thấp hơn 30 và giao dịch lớn hơn trung bình di chuyển của nó
- Bước đầu vào: Khi RSI cao hơn 70 (thay quá) và khối lượng giao dịch lớn hơn trung bình di chuyển của nó
- Lập luận ra sân:
- Lần ra sân: 50 trên RSI
- Bỏ đầu ra sân: mặc 50 dưới RSI
Lợi thế chiến lược
- Quyết định giao dịch có hệ thống: Xây dựng hệ thống giao dịch khách quan thông qua một bộ chỉ số kỹ thuật rõ ràng
- Cơ chế xác nhận đa chiều: kết hợp hai chiều RSI và khối lượng giao dịch để tăng độ tin cậy tín hiệu
- Kiểm soát rủi ro tốt: sử dụng quản lý quỹ theo tỷ lệ phần trăm và cấm xây dựng lại kho
- Hỗ trợ hình ảnh: bao gồm các chức năng hiển thị biểu đồ đầy đủ để phân tích và giám sát dễ dàng
- Khả năng thích ứng: Các tham số chính có thể được tùy chỉnh để thích ứng với các môi trường thị trường khác nhau
Rủi ro chiến lược
- Rủi ro tiếp tục xu hướng: Chiến lược đảo ngược có thể thường xuyên thua lỗ trong thị trường xu hướng mạnh
- Rủi ro đột phá giả mạo: khối lượng giao dịch cao không nhất thiết có nghĩa là thị trường thực sự biến đổi
- Tính nhạy cảm của tham số: Thời kỳ RSI và lựa chọn mua quá giá và bán quá giá có ảnh hưởng đáng kể đến hiệu suất chiến lược
- Tác động điểm trượt: Trong thời gian biến động mạnh, giá giao dịch có thể lệch đáng kể so với dự kiến
- Rủi ro quản lý vốn: Vị trí tỷ lệ cố định có thể quá mạnh trong một số tình huống thị trường
Hướng tối ưu hóa chiến lược
- Trình lọc xu hướng: giới thiệu các chỉ số đánh giá xu hướng, tránh giao dịch đảo ngược trong thời gian xu hướng mạnh
- Các tham số động: Thấp giá quá mua quá bán của RSI được điều chỉnh động dựa trên biến động thị trường
- Tối ưu hóa xuất phát: tăng các cơ chế dừng lỗ và theo dõi, nâng cao khả năng kiểm soát rủi ro
- Tăng cường phân tích khối lượng giao dịch: Thêm phân tích hình dạng khối lượng giao dịch để cải thiện chất lượng tín hiệu
- Bộ lọc thời gian: Thêm cửa sổ thời gian giao dịch để tránh thời gian giao dịch kém hiệu quả
Tóm tắt
Chiến lược này được xây dựng bằng cách kết hợp các chỉ số RSI và phân tích khối lượng giao dịch để xây dựng một hệ thống giao dịch đảo ngược hoàn chỉnh. Chiến lược được thiết kế hợp lý, có khả năng hoạt động tốt và linh hoạt. Với hướng tối ưu hóa được đề xuất, chiến lược có thể được nâng cao hơn nữa.
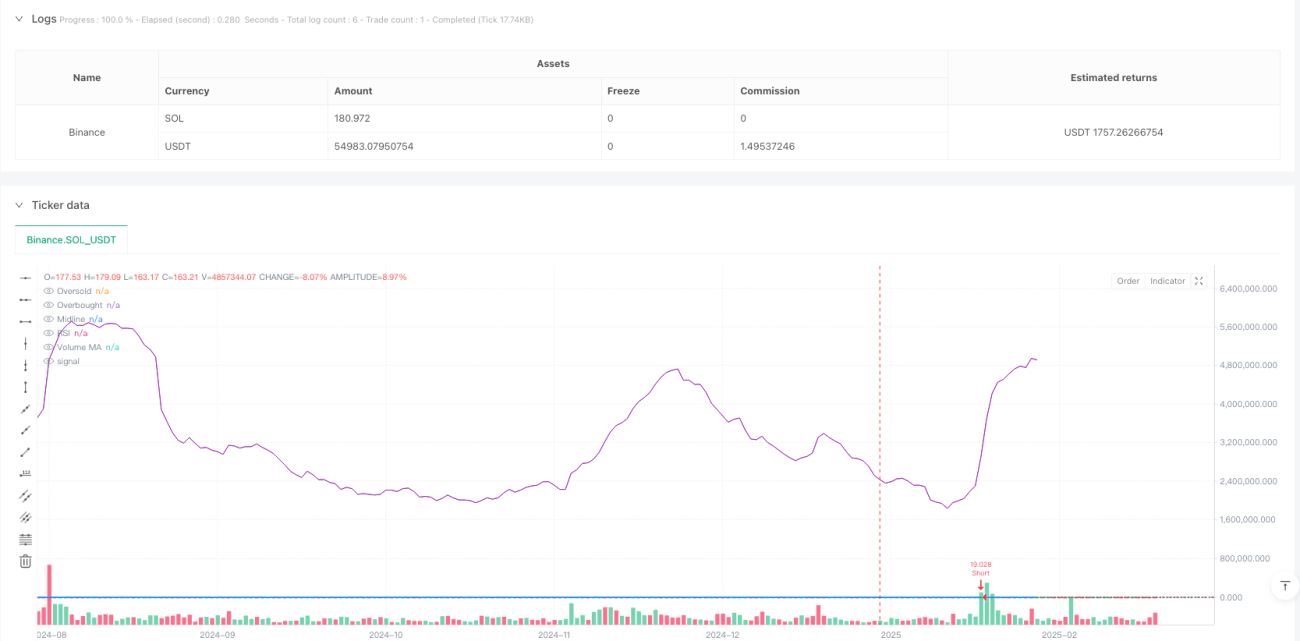
/*backtest
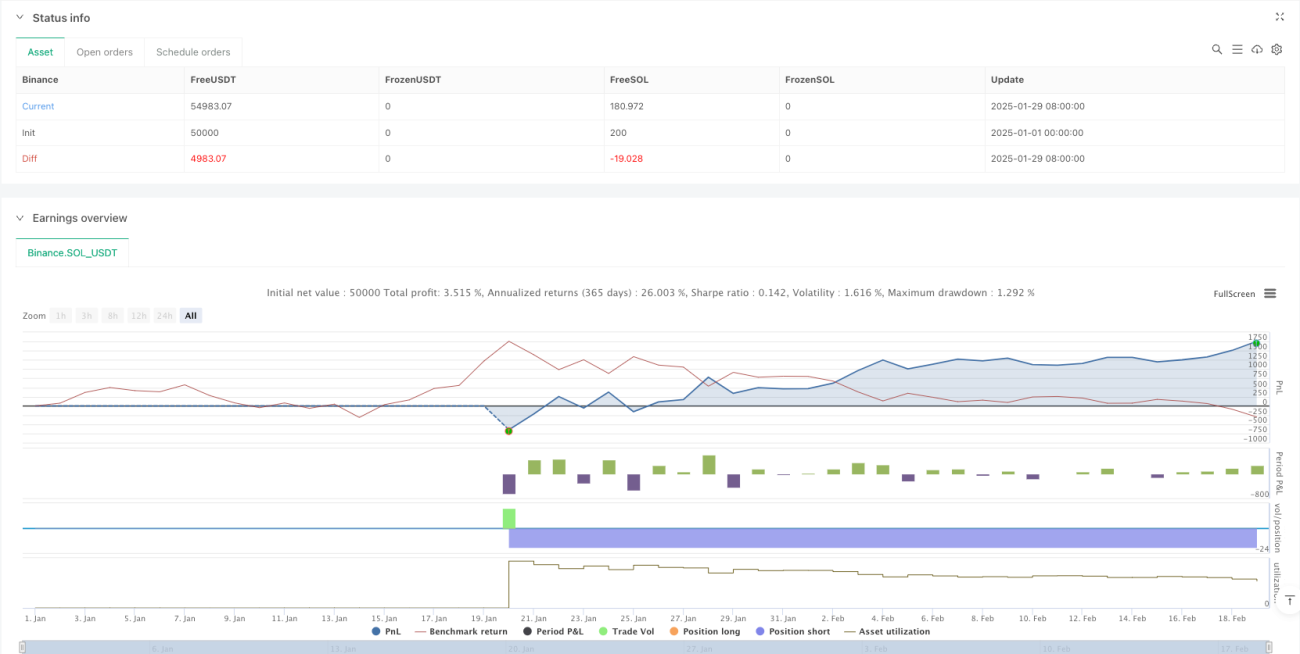
start: 2025-01-01 00:00:00
end: 2025-02-19 08:00:00
period: 1d
basePeriod: 1d
exchanges: [{"eid":"Binance","currency":"SOL_USDT"}]
*/
//@version=5
strategy("RSI & Volume Contrarian Strategy", overlay=true, initial_capital=100000, default_qty_type=strategy.percent_of_equity, default_qty_value=10, pyramiding=0)
//---------------------------- 1