
Tổng quan
Chiến lược này là một hệ thống giao dịch tự điều chỉnh kết hợp với ZigZag phần trăm đảo ngược và chỉ số ngẫu nhiên. Nó xác định các điểm đảo ngược quan trọng bằng cách tính toán động các biến động của thị trường và kết hợp với các tín hiệu ngẫu nhiên để xác định thời gian giao dịch. Chiến lược này tích hợp cơ chế dừng lỗ tự động để quản lý rủi ro hiệu quả.
Nguyên tắc chiến lược
Cốt lõi của chiến lược là theo dõi xu hướng thị trường một cách động thông qua phương pháp đảo ngược phần trăm. Nó cho phép người dùng lựa chọn đặt phần trăm đảo ngược bằng tay hoặc tính toán động ATR dựa trên chu kỳ khác nhau (khoảng 5 đến 250 ngày).
Lợi thế chiến lược
- Sử dụng phương pháp tính toán ngược tự điều chỉnh động để thích ứng tốt hơn với các môi trường thị trường khác nhau
- Kết hợp các chỉ số biến động và biến động để cung cấp tín hiệu giao dịch đáng tin cậy hơn
- Cấu trúc Stop Loss được tích hợp để giúp các trader tự động quản lý rủi ro
- Cài đặt tham số linh hoạt cho phép các trader tối ưu hóa tùy theo phong cách giao dịch cá nhân
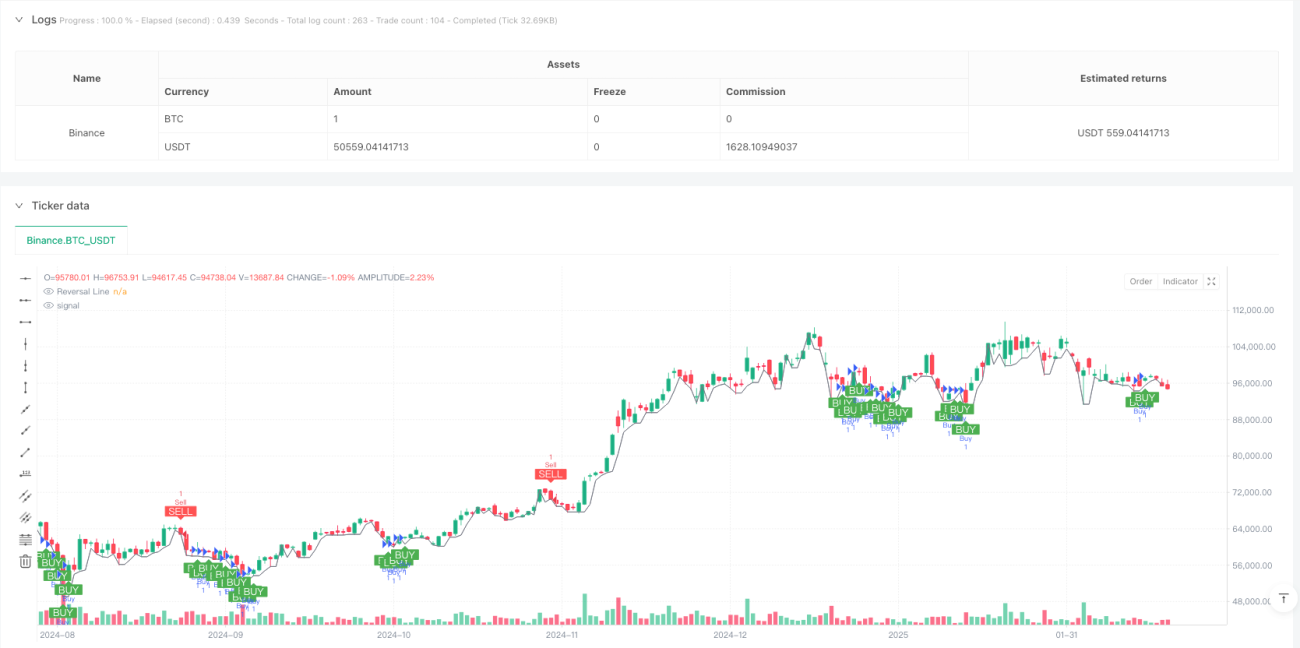
- Hiển thị tín hiệu giao dịch trực quan, giúp phân tích và quyết định
Rủi ro chiến lược
- Các tín hiệu sai có thể xảy ra thường xuyên trong thị trường chấn động
- Lựa chọn chu kỳ ATR ảnh hưởng đến hiệu suất chiến lược
- Lệnh dừng cố định có thể không phù hợp với tất cả các điều kiện thị trường
- Chỉ số ngẫu nhiên có thể bị tụt hậu trong một số điều kiện thị trường
- Cần thiết lập các tham số hợp lý để tránh giao dịch quá mức
Hướng tối ưu hóa chiến lược
- Nhập phân tích nhiều khung thời gian để tăng độ tin cậy tín hiệu
- Động thái điều chỉnh mức dừng lỗ để thích ứng tốt hơn với biến động của thị trường
- Thêm chỉ số khối lượng giao dịch làm tín hiệu xác nhận
- Phát triển tham số chỉ số ngẫu nhiên thích ứng
- Tăng cường độ xu hướng bộ lọc giảm tín hiệu giả
Tóm tắt
Đây là một chiến lược giao dịch hiện đại kết hợp các công cụ phân tích kỹ thuật cổ điển. Bằng cách tích hợp ZigZag reversal, chỉ số ngẫu nhiên và quản lý rủi ro, nó cung cấp cho các nhà giao dịch một hệ thống giao dịch toàn diện. Chiến lược có khả năng tùy biến mạnh mẽ, phù hợp với các nhà giao dịch có sở thích rủi ro khác nhau.
- 1